TMS IntraWeb Charts
Fast multipane financial graphs & 2D feature rich charting
Tips and Frequently Asked Questions

 Showing values in bars
You can accomplish this by using the following code (based on a default TAdvChartView)
procedure TForm1.DoGetBarValueText(Sender: TObject; Serie, PointIndex: integer;
  AFont: TFont; var BarText: String; var Alignment: TAlignment);
begin
  BarText := floattostr(AdvChartView1.Panes[0].Series[Serie].Points[PointIndex].SingleValue);
end;

procedure TForm1.FormCreate(Sender: TObject);
begin
  AdvChartView1.BeginUpdate;
  AdvChartView1.InitSample;
  AdvChartView1.Panes[0].Series.Delete(0);
  AdvChartView1.Panes[0].Series.Delete(0);
  AdvChartView1.Panes[0].Series[0].ChartType := ctbar;
  AdvChartView1.Panes[0].Series[0].OnGetBarValueText := DoGetBarValueText;
  AdvChartView1.EndUpdate;
end;

 Using the Popup ToolBar
The chart supports displaying a helper popup toolbar that offers various functionality such as changing the series type, fill and line color as well a specifying the marker type and label visibility.
To enable the popup, set Popup.Enabled := True;
AdvChartView1.Popup.Enabled := True;
When clicking on a series point, slice, or bar depending on the chosen series type the popup will be shown and initialized based on the current settings of the series.
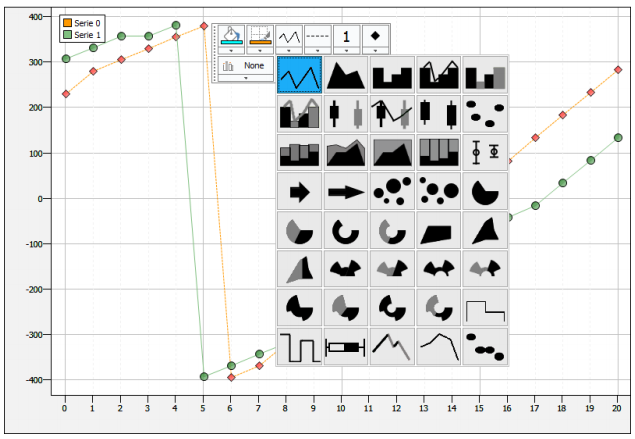
The popup options can be configured via the Popup.Options property. This allows you to show more or less dropdown pickers depending on the series configuration. Below is a sample that demonstrates displaying the full set of options versus a limited set with line color, type and width.
AdvChartView1.Popup.Options := AllOptions;

AdvChartView1.Popup.Options := [ctpoStroke, ctpoLineStyle, ctpoLineWidth];


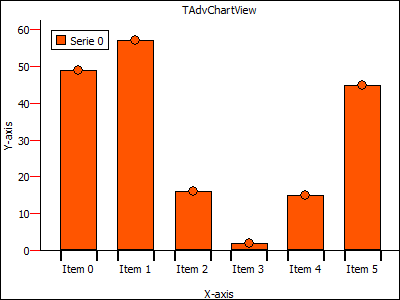
 Custom X-Axis drawing
procedure TForm1.FormCreate(Sender: TObject);
var
  I: Integer;
begin
  AdvChartView1.BeginUpdate;
  AdvChartView1.Panes[0].Series[2].Free;
  AdvChartView1.Panes[0].Series[1].Free;
  AdvChartView1.Panes[0].Series[0].OnXAxisDrawValue := XAxisDrawVal;
  AdvChartView1.Panes[0].Series[0].ChartType := ctBar;
  AdvChartView1.Panes[0].Series[0].XAxis.AutoUnits := False;
  AdvChartView1.Panes[0].XAxis.AutoSize := False;
  AdvChartView1.Panes[0].Series[0].AutoRange := arEnabledZeroBased;
  AdvChartView1.Panes[0].XAxis.Size := 50;
  for I := 0 to 9 do
    AdvChartView1.Panes[0].Series[0].AddSinglePoint(Random(100), ''Item '' + inttostr(I));
  AdvChartView1.EndUpdate;
end;

procedure TForm1.XAxisDrawVal(Sender: TObject; Serie: TChartSerie;
  Canvas: TCanvas; ARect: TRect; ValueIndex, XMarker: integer; Top: Boolean;
  var defaultdraw: Boolean);
var
  bw, tw: Integer;
  s: string;
begin
  defaultdraw := False;
  bw := Serie.GetBarWidth(1) div 2;
  Canvas.Pen.Color := clBlack;
  Canvas.Pen.Width := 2;
  Canvas.MoveTo(XMarker - bw + 1 , ARect.Top);
  Canvas.LineTo(XMarker - bw + 1, ARect.Top + 10);
  Canvas.MoveTo(XMarker + bw + 1, ARect.Top);
  Canvas.LineTo(XMarker + bw + 1, ARect.Top + 10);
  s := Serie.Points[ValueIndex].LegendValue;
  tw := Canvas.TextWidth(s);
  Canvas.TextOut(XMarker - tw div 2, ARect.Top + 12, s);
end;

 Exporting to PDF
To print the chart to a PDF, you can use following code:
  with printer do
  begin
    BeginDoc;
    AdvChartView2.PrintAllPanes(Printer.Canvas,Rect(0, 0, printer.PageWidth, printer.PageHeight));
    EndDoc;
  end;
 Custom x-axis value drawing
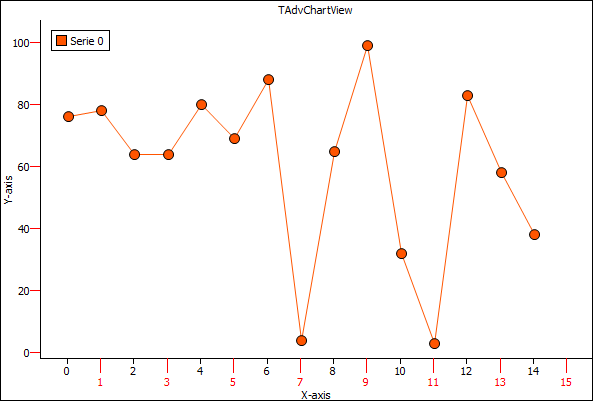
The distance between X-Axis values is determined by the X-Scale, which is calculated based on the RangeFrom and RangeTo properties on pane level. Additionally, the X-Axis can display major units and minor units with their own font size. Below is a sample that demonstrates this:
procedure TForm127.DrawXAxisValue(Sender: TObject; Serie: TChartSerie; Canvas: TCanvas; ARect: TRect; ValueIndex, XMarker: integer; Top: Boolean; var defaultdraw: Boolean);
var
  s: string;
  tw: Integer;
begin
  if Odd(ValueIndex) then
  begin
    DefaultDraw := False;
    s := IntToStr(ValueIndex);
    tw := Canvas.TextWidth(s);
    Canvas.Pen.Color := clRed;
    Canvas.MoveTo(XMarker, ARect.Top);
    Canvas.LineTo(XMarker, ARect.Top + 15);
    Canvas.Font.Color := clRed;
    Canvas.TextOut(XMarker - tw div 2, ARect.Top + 17, s);
  end;
end;

procedure TForm127.FormCreate(Sender: TObject);
var
  I: Integer;
begin
  AdvGDIPChartView1.BeginUpdate;
  AdvGDIPChartView1.InitSample;
  AdvGDIPChartView1.Panes[0].Range.RangeTo := 15;
  AdvGDIPChartView1.Panes[0].XAxis.AutoSize := True;
  AdvGDIPChartView1.Panes[0].Series[2].Free;
  AdvGDIPChartView1.Panes[0].Series[1].Free;
  AdvGDIPChartView1.Panes[0].Series[0].ClearPoints;
  AdvGDIPChartView1.Panes[0].Series[0].AutoRange := arEnabled;
  AdvGDIPChartView1.Panes[0].Series[0].XAxis.AutoUnits := False;
  AdvGDIPChartView1.Panes[0].Series[0].XAxis.MajorUnit := 2;
  AdvGDIPChartView1.Panes[0].Series[0].XAxis.MinorUnit := 1;
  AdvGDIPChartView1.Panes[0].Series[0].OnXAxisDrawValue := DrawXAxisValue;

  for I := 0 to 14 do
    AdvGDIPChartView1.Panes[0].Series[0].AddSinglePoint(Random(100));

  AdvGDIPChartView1.EndUpdate;
end;

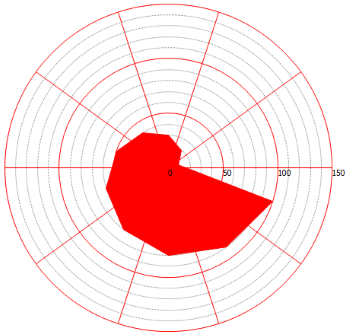
 How to configure the y-axis and y-grid of a spider chart
Simply drop a chart on the form and set the code in the formcreate. The y-axis and y-grid are configured to display every 20 units.
Sample code:
var
  s: TChartSerie;
  p: TChartPane;
  I: Integer;
begin
  AdvGDIPChartView1.BeginUpdate;
  AdvGDIPChartView1.Panes.Clear;
  p := AdvGDIPChartView1.Panes.Add;
  p.YAxis.AutoUnits := False;
  p.YGrid.AutoUnits := False;
  s := p.Series.Add;
  s.ChartType := ctSpider;
  s.Pie.Size := 300;
  s.YAxis.AutoUnits := False;

  s.YAxis.MajorUnit := 50;
  s.YAxis.MinorUnit := 10;

  p.YGrid.MinorDistance := 10;
  p.YGrid.MajorDistance := 50;

  p.YGrid.MajorLineColor := clRed;

  for I := 0 to 9 do
  begin
    s.AddSinglePoint((I + 1) * 10);
  end;

  AdvGDIPChartView1.EndUpdate;

 How to use gantt charts

 Resetting Automatic after manual Scaling / Ranging
To reset the chart after manual scaling / scrolling, set the property mode on series level to cmInit encapsulated with a beginupdate and an endupdate:
AdvChartView1.BeginUpdate;
AdvChartView1.Panes[0].Series.Mode := cmInit;
AdvChartView1.EndUpdate;

 Selecting points in a series
Below is a sample code with XYLine chart that allows selection of the point with the SelectedIndex property.
var
  I: Integer;
begin
  with AdvChartView1.Panes[0] do
  begin
    Range.RangeTo := 10;
    Series.Clear;
    with Series.Add do
    begin
      ChartType := ctxyLine;
      SelectedIndex := 4;
      SelectedMark := True;
      for I := 0 to 10 do
        AddSingleXYPoint(I / 2, Random(100), RGB(Random(255), Random(255), Random(255)));
    end;
  end;

 Printing GDI+ charts
Below is a sample to print GDI+ charts:
http://www.tmssoftware.net/public/PrintDemo.zip
The GDI+ charts are a combination of GDI and GDI+. some elements are drawn in GDI and some elements are drawn in GDI+. Therefore printing a GDI+ chart directly on the printer canvas (which has a different DPI) results in elements with incorrect dimensions. The sample shows how a GDI+ chart can be printed on a bitmap, which is then printed on the printer canvas.

 Using custom Y-Axis labels
it is possible to use custom Y-Axis labels by implementing the OnYAxisGetValue event:
AdvChartView1.Panes[0].Series[0].OnYAxisGetValue := YAxisGetVal;

procedure TForm1.YAxisGetVal(Sender: TObject; Serie: TChartSerie;
  Value: double; var AValue: string);
begin
  AValue := floattostr(Value - 15);
end;

 What is the difference between TMS Advanced Charts for IntraWeb and TMS Advanced Charts
There is no difference.
TMS Advanced Charts for IntraWeb is equal to TMS Advanced Charts. The product contains chart components that can be used for VCL Windows application development as well as IntraWeb web application development.

 Setting a custom division on the X-Axis
With this code, you can switch of the autounits and set a custom division on the X-Axis:
AdvChartView1.Panes[0].Series[0].XAxis.AutoUnits := False;
AdvChartView1.Panes[0].Series[0].XAxis.MajorUnit := 10;
AdvChartView1.Panes[0].Series[0].XAxis.MinorUnit := 0;

 Exporting to PNG, JPEG, TIFF, BMP or GIF files (GDI+)
Saving to a Windows bitmap file offers good quality but generates large files. You can save the AdvChartView to different image formats to improve / reduce the size and quality. The image formats currently supported are JPEG, PNG, BMP, GIF, TIFF. You can also save a single pane to a different image format. Using the method SaveToImage(), by default the image will be saved to Windows bitmap (BMP) format. If you set the extra format parameter (itJPEG, itBMP, itPNG, itGIF, itTIFF), you can choose in which encoded image type your result image will be saved.
Example:
Save to a jpeg with 50 % quality (quality only has effect on the jpeg format).
if SavePictureDialog1.Execute then
begin
  //for example the size of the picture has been set to a 1000 x 500
  //resolution.
  AdvChartView1.SaveToImage(SavePictureDialog1.FileName, 1000, 500, itJPEG, 50);
end;
if SavePictureDialog1.Execute then
begin
  //for example the size of the picture has been set to a 1000 x 500
  //resolution.
  AdvChartView1.Panes[0].Chart.SaveToImage(SavePictureDialog1.FileName, 1000, 500, itPNG);
end;
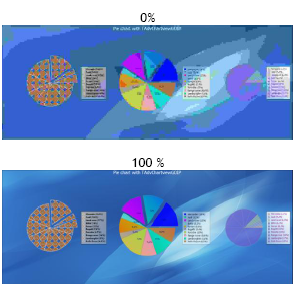

 Printing
The support for printing in TAdvChartView is on level of panes. The chart can print a single pane or can print all panes at once. As the print function just sends the chart to a destination Canvas, the print function can be used to send the chart to a printer device but it can be used to send the output also to a memory bitmap canvas:
Print on a printer
if PrinterSetupDialog1.Execute then
begin
  with printer do
  begin
    BeginDoc;

    //The rectangle to print the AdvChartView.
    r := Rect(0, 0, printer.PageWidth, printer.PageHeight);

    AdvChartView.PrintAllPanes(Printer.Canvas, r);
    //OR print a single pane.
    AdvChartView.PrintPane(0, Printer.Canvas, r);

    EndDoc;
  end;
end;if SavePictureDialog1.Execute then begin //for example the size of the picture has been set to a 1280 x 1024 //resolution. AdvChartView1.SaveAllPanesToBitmap(SavePictureDialog1.FileName ,1280, 1024); end;
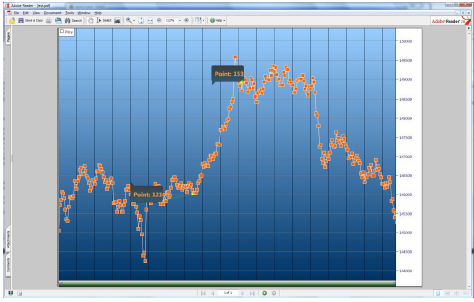

 Saving and restoring TAdvChartView settings
All properties of the TAdvChartView can be saved to a .Chart file. If you close the application and load the .Chart file, all settings will be restored. Here is an example of saving / reloading settings in code.
Save settings:
procedure TForm1.SaveToFile1Click(Sender: TObject);
begin
  if SaveDialog1.Execute then
  begin
    AdvChartView1.SaveToFile(SaveDialog1.FileName);
    ShowMessage('Settings Saved');
  end;
end;procedure TForm1.LoadSettings1Click(Sender: TObject);
begin
if OpenDialog1.Execute then
begin
AdvChartView1.LoadFromFile(OpenDialog1.FileName);
ShowMessage('Settings Loaded');
end;
end;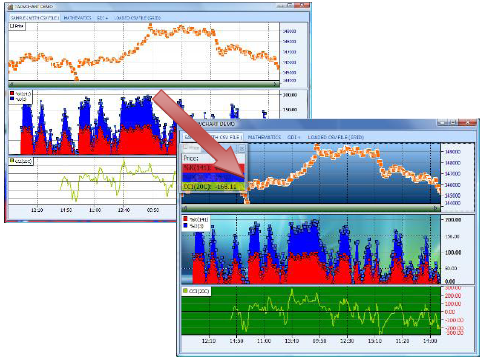

 Adding Special Series
TMS Advanced Charts allows you to add trend lines, moving averages, line series and band series. This series is not visible in the legend and will be used as an extra calculated data � series. These series are automatically calculated from specific values in a defined range from series available in the chart. As such, it is mandatory to first add the series values and when values are added, call the method to calculate the trend line series, moving averages series etc�
Trend Channel
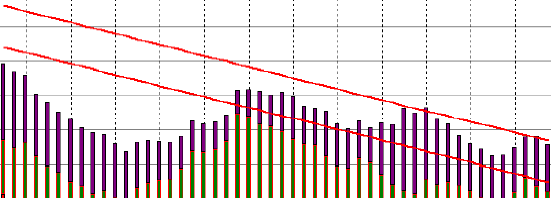
Moving Average
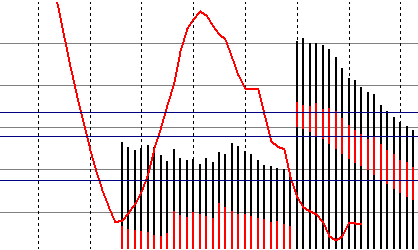
Below are the method definitions that can be used to add informational series to the chart.
procedure AddLineSerie(startx, endx: integer; startvalue, endvalue: Double; UseCommonYRange: Boolean = true; serielinecolor: TColor = clBlack; serielinewidth: integer = 1);

procedure AddBandSerie(startx, endx: integer; startvalue1, startvalue2, endvalue1,endvalue2: Double; UseCommonYRange: Boolean = true; serielinecolor: TColor = clBlack; serielinewidth: integer = 1;seriebandcolor: TColor = clGray);

procedure AddTrendLine(serieindex, startx, endx: integer; UseCommonYRange: Boolean = true; serielinecolor: TColor = clBlack; serielinewidth: integer = 1);

procedure AddTrendChannel(serieindex, startx, endx: integer; UseCommonYRange: Boolean = true; serielinecolor: TColor = clBlack; serielinewidth: integer = 1);

procedure AddTrendChannelBand(serieindex, startx, endx: integer; UseCommonYRange: Boolean = true; serielinecolor: TColor = clBlack; serielinewidth: integer = 1; seriebandcolor: TColor = clGray);

procedure AddMovingAverage(serieindex, startx, endx, window: integer; UseCommonYRange: Boolean = true; serielinecolor: TColor = clBlack; serielinewidth: integer = 1);

procedure AddParetoLine(serieindex, startx, endx: integer; UseCommonYRange: Boolean = true; serielinecolor: TColor = clBlack; serielinewidth: integer = 1);

 Programmatic use of DBAdvChartView & TDBAdvGDIPChartView
Below is a code sample to show values from a Microsoft Access Database, using an AdoDataSet, AdoConnection and a Datasource.
Drop a TDBAdvGDIPChartView, TAdoConnection, TAdoTable and a TDataSource on the form. Insert this code in the procedure FormCreate:
procedure TForm1.FormCreate(Sender: TObject);
var
  I: integer;
begin
  DBAdvGDIPChartView1.Panes[0].BorderColor := clBlack;
  DBAdvGDIPChartView1.Panes[0].BorderWidth := 3;

  with DBAdvGDIPChartView1.Panes[0] do
  begin
    Series.Clear;
    //Set connection string to database
    ADOConnection1.ConnectionString :=
'Provider=Microsoft.Jet.OLEDB.4.0;Data
Source=sales.mdb;Persist Security Info=False';
    ADOConnection1.Connected := true;

    //Set tablename
    ADOTable1.Connection := ADOConnection1;
    ADOTable1.TableName := 'Sales';

    //link to Datasource and datasource to chart
    DataSource1.DataSet := ADOTable1;
    //Datasource property of Chart
    DataSource := DataSource1;

    XAxis.Position := xNone;
    YAxis.Position := yNone;
    Title.Color := RGB(255, 255, 210);
    Title.ColorTo := RGB(255, 255, 210);
    Title.BorderColor := clBlack;
    Title.BorderWidth := 1;
    Title.GradientDirection := cgdVertical;
    Title.Size := 50;
    Title.Text := 'Database Spider Chart';
    Title.Font.Size := 14;
    Title.Font.Style := [fsBold];
    Background.GradientType := gtHatch;
    Background.HatchStyle := HatchStyleWideDownwardDiagonal;
    Background.Color := RGB(255, 255, 210);
    BackGround.ColorTo := clWhite;
    Legend.Visible := false;
    Margin.LeftMargin := 0;
    Margin.rightMargin := 0;
    Margin.TopMargin := 0;
    series.DonutMode := dmStacked;

    YAxis.AutoUnits := false;
    YGrid.MajorDistance := 50;
    YGrid.MinorDistance := 10;
    YGrid.MinorLineColor := clSilver;
    YGrid.MajorLineColor := clDkGray;
    YGrid.MinorLineStyle := psDash;

    Series.Add;

    with Series[0] do
    begin
      Pie.LegendOffsetTop := (Self.Height div 2) - 150;
      Pie.LegendColor := clRed;
      Color := clRed;
      FieldNameValue := 'Product X';
      FieldNameXAxis := 'Sales by Region';
      LegendText := 'Product X';
      Pie.LegendTitleColor := clRed;
      Pie.ValueFont.Color := clRed;
    end;

    Series.Add;

    with Series[1] do
    begin
      Pie.LegendOffsetTop := (Self.Height div 2);
      Pie.LegendColor := clGreen;
      Color := clGreen;
      Pie.ShowGrid := false;
      YAxis.Visible := false;
      FieldNameValue := 'Product Y';
      FieldNameXAxis := 'Sales by Region';
      LegendText := 'Product Y';
      Pie.LegendTitleColor := clGreen;
      Pie.ValueFont.Color := clGreen;
    End;

    Series.Add;

    with Series[2] do
    begin
      Pie.LegendOffsetTop := (Self.Height div 2) + 150;
      Pie.LegendColor := clBlue;
      Color := clBlue;
      Pie.ShowGrid := false;
      YAxis.Visible := false;
      FieldNameValue := 'Combined';
      FieldNameXAxis := 'Sales by Region';
      LegendText := 'Combined';
      Pie.LegendTitleColor := clBlue;
      Pie.ValueFont.Color := clBlue;
    end;

    for I := 0 to Series.Count - 1 do
    begin
      with Series[I] do
      begin
        YAxis.MajorUnit := 50;
        YAxis.MajorUnit := 25;
        Pie.LegendTitleVisible := true;
        Pie.LegendOpacity := 50;
        Pie.LegendOpacityto := 0;
        Pie.LegendTitleOpacity := 50;
        Pie.LegendGradientType := gtForwardDiagonal;
        Pie.LegendBorderColor := clBlack;
        Pie.Position := spCustom;
        Pie.Left := self.Width div 3;
        Pie.Top := self.Height div 2;
        Pie.LegendFont.Size := 10;
        ValueFormat := '$%g,000';
        Pie.ValueFont.Size := 10;
        ChartType := ctSpider;
        Opacity := 50;
        LineColor := clBlack;
        AutoRange := arCommonZeroBased;
        Pie.Size := 400;
        Pie.ShowValues := true;
        Pie.ValuePosition := vpOutSideSlice;
        Pie.LegendPosition := spCustom;
        Pie.LegendOffsetLeft := Self.Width - 150;
      end;
    end;
     // open connection
    ADOTable1.Active := true;
  end;
end;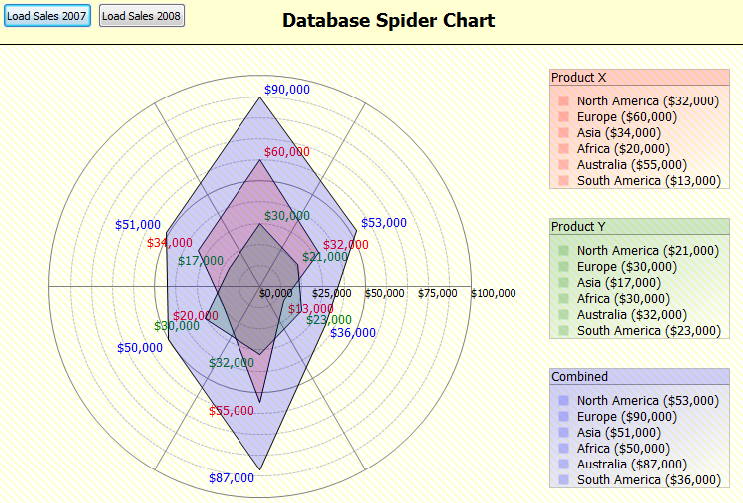

 Linking TMS Advanced Charts with databases
TMS Advanced Charts has the ability to link with databases and automatically add points from record fields. To do this, the DB-aware chart can be linked to a dataset via a datasource and the dataset field can be choosen for the values of a series and optionally a different dataset field can be chosen as X-axis values. The DB-aware chart will automatically load values of all rows in the dataset as series data points and it will also automatically update values when the dataset is being edited or when new rows are inserted in the dataset.
Connecting DataSource to the Chart
Drop a TDBAdvGDIPChartView on the form. When double-clicking the chart view, the panes editor dialog shows and a new tabsheet named Database.
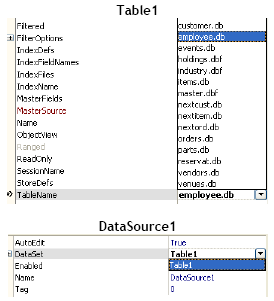
Drop a TTable component on the form. Choose DBDemos as database and employees.db as tablename. Then link the TTable to the TDataSource by choosing Table1 as Dataset.
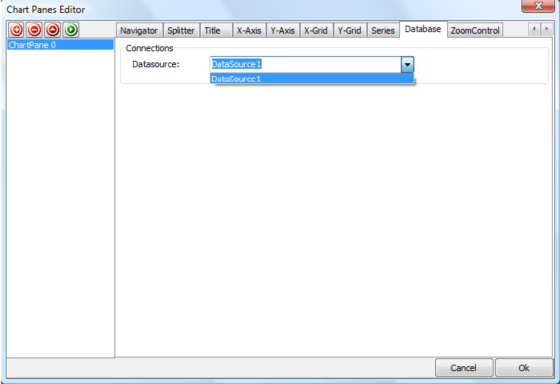
Double-click on the chart to start the panes editor dialog. Go to the TabSheet Database and select DataSource1 as DataSource property. Return to the form and set Active to true on Table1 dataset.
Connecting Fields to Series
After setting the DataSource on the chart the series are aware of the selected tablename and will display the fields of the table employees.db
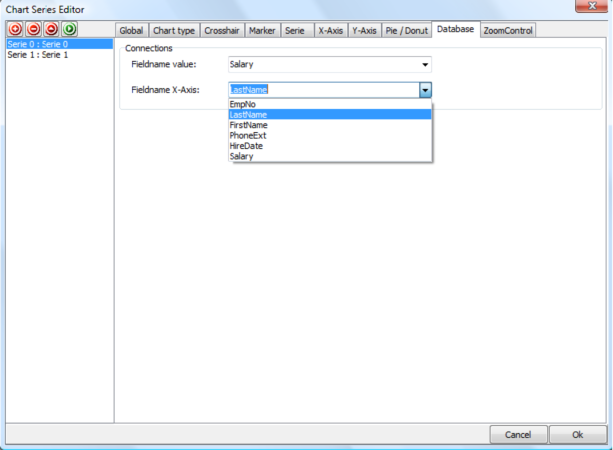
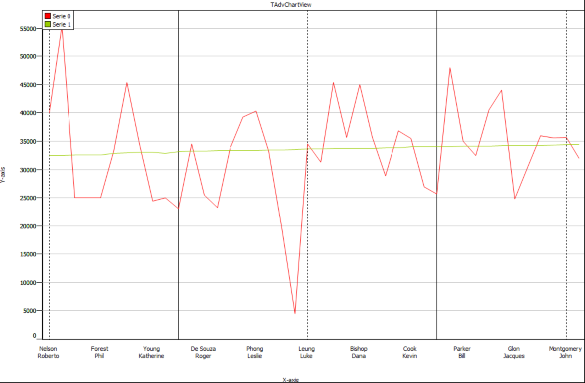
Remove the 2 other series and leave series 0. Select Salary as Fieldname value for Series 0 and LastName as Fieldname X-Axis for Series 0. After saving the changes, the chart will automatically be updated with every record that exists in the database. Choose a line type and change the AutoRange to arEnabled for automatic Y-Range.
Result:

 Using the Zoom Control Window in TAdvGDIPChartView
TMS Advanced Charts also comes with a GDI+ version of TAdvChartView and adds extra features such as a special zoom control window.
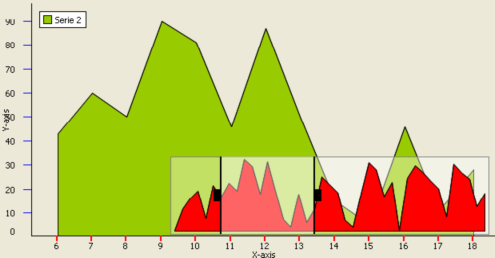
The zoom control window allows the user to navigate through the chart and always displays the complete chart range by default. There are 2 handles that can be dragged left or right representing the RangeFrom and RangeTo of the Chart. The zoom control appearance can be customized in the GDI+ Panes Editor Dialog.
When you start the application, the zoomcontrol window will be empty. Therefore it is important to link the series by setting the SerieType property of TAdcChartSerie. The SerieType property specifies how and what series from the series collection of the chart is used on the zoomcontrol.
stNormal: This is the default value, the series will not be visible in the zoom control window.
stZoomControl: The series will only be displayed in the zoom control window.
stBoth: The series will be displayed in the zoom control window and as a normal series.
By default the chart will be automatically updated when changing the range. The property AutoUpdate can be changed to update immediate, upon release of the mouse button, or no automatic update. When no automatic update is set, you can use the 3 events below:
OnZoomControlRangeChanged: Event triggered when Range is updated after mouse button release
OnZoomControlRangeChanging: Event triggered when Range is updated when mouse is moving
OnZoomControlSelection: Event triggered when Range is updated after dragging the Selection area between the range from and range to.

 Adding and removing annotations
Start the AnnotationEditorDialog and click on the- sign to remove or the + sign to add an annotation. You can add multiple annotations per series. Here is an example to remove an annotation and to add an annotation to the first series of the first pane.
procedure TForm1.AddNewAnnotation;
var
  ca: TChartAnnotation;
begin
  ca := AdvChartView.Panes[0].Series[0].Annotations.Add;
  // set properties of the chart annotation here
end;

procedure TForm1.RemoveAnnotation;
begin
  AdvChartView.Panes[0].Series[0].Annotations[0].Free;
end;
Example with annotations:
procedure TForm1.AddNewAnnotation;
begin
  with AdvChartView.Panes[0].Series[0].Annotations.Add do
  begin
    // ADD ALL CODE TO SET PROPERTIES HERE EXAMPLE:
    Shape := asBalloon;
  end;
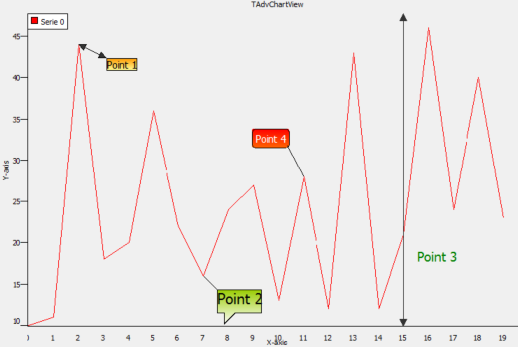
end;Balloon, Circle, RoundRectangle, Rectangle : Shapes to wrap around the text.
Line: a line drawn from top to bottom on the X-position of the point.
Offset (X, Y): the text offset from the X, Y- position of the point.
Here is a screenshot with the different shapes.

 Changing different bar chart types to cylinder shape or pyramid shape
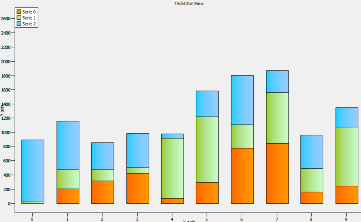
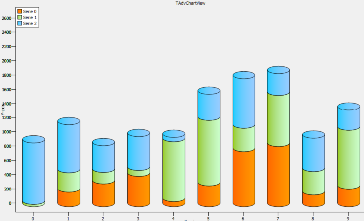
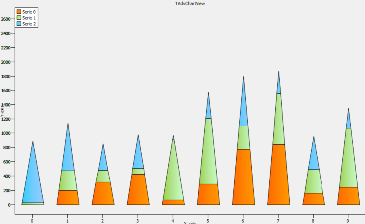
When adding new bar type charts the shape of the bar is bsRectangle by default. When changing the BarShape property on Series level the shape of the bar can be a Rectangle, Cylinder or a Pyramid.
Below is a sample that demonstrates the different shapes with one line of code for each series.
AdvGDIPChartView1.Panes[0].Series[0].BarShape := bsRectangle;
AdvGDIPChartView1.Panes[0].Series[1].BarShape := bsRectangle;
AdvGDIPChartView1.Panes[0].Series[2].BarShape := bsRectangle;
AdvGDIPChartView1.Panes[0].Series[0].BarShape := bsCylinder;
AdvGDIPChartView1.Panes[0].Series[1].BarShape := bsCylinder;
AdvGDIPChartView1.Panes[0].Series[2].BarShape := bsCylinder;
AdvGDIPChartView1.Panes[0].Series[0].BarShape := bsPyramid;
AdvGDIPChartView1.Panes[0].Series[1].BarShape := bsPyramid;
AdvGDIPChartView1.Panes[0].Series[2].BarShape := bsPyramid;

 Customizing the drawing of the markers.
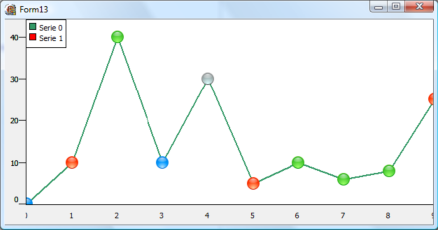
A marker can be selected. Set the SelectedColor and the SelectedSize property. Click on the marker at runtime, the marker will be shown in the selected color & size. To add code when a marker is clicked you can use the SerieMouseDown or SerieMouseUp event. This can be used for example to add an annotation at a specific point of the series.
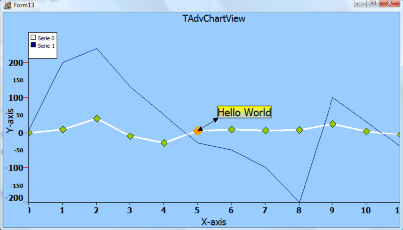
It is possible to customize the drawing of the markers. Select mCustom as marker type and use the event OnMarkerDrawValue. Follow sample code snippet shows how this can be done:
type
  TForm1 = class(TForm)
  private
     { private declarations }
  public
     { public declarations }
    procedure DrawMarker(Sender: TObject; Serie: TChartSerie; Canvas: TCanvas; X, Y,Point: integer; value: TChartPoint);
end;AdvChartview.Panes[0].Series[0].OnMarkerDrawValue := DrawMarker;

 Adding single, multi points
Depending on the chosen chart type different methods are available to add series data point values to a series. This is done via a number of overload functions of AddSinglePoint and AddMultiPoint. For some chart types, a single value per series data point is sufficient. Other chart types such as a band chart or OHLC chart require 2 or 4 values per series data point. Additional settings per data point might be necessary such as a specific chart X-axis value for a data point or a color of a data point for a histogram.
The easiest way to add points is with the method AddSinglePoint or AddMultiPoint. Alternatively the methods SetSinglePoint or SetMultiPoint can also be used to change values of some data points in a serie. Note though that when no data points are added in the series, it is required to set the number of points first with the method SetArraySize() before using SetSinglePoint or SetMultiPoint. In this example we use the Add Methods:
Example: Adding some random points for different chart types.
procedure TForm1.AddRandomSinglePoints;
var
  i: integer;
begin
  with AdvChartView.Panes[0].Series[0] do
  begin
    //Applies to ctLine, ctDigitalLine, ctBar, ctArea, ctHistogram, ctLineBar,
    //ctLineHistogram, ctStackedBar, ctStackedArea, ctStackedPercBar,
    //ctStackedPercArea, ctMarkers
    for i := 0 to 10 do
      AddSinglePoint(Random(50));
    //Applies to ctArrow, ctError, ctScaledArrow, ctBubble,
    //ctScaledBubble (Random points with X an Y offset)
    for i := 0 to 10 do
      AddPoints(Random(50), XOffset, YOffset);
  end;
end;

procedure TForm1.AddRandomMultiPoints;
var
  i: integer;
begin
  with AdvChartView.Panes[0].Series[0] do
  begin
     //Randomly add some points ranging from 0 to 10
    //Applies to ctCandleStick, ctOHLC, ctLineCandleStick
    for i := 0 to 10 do
      AddMultiPoints(Random(50), Random(50), Random(50), Random(50));
  end;
end;Example: Adding points for every month of the year.
You can quickly add custom text to the X-axis by using one of the overloaded AddSinglePoint methods.
for I := 0 to 11 do
begin
  AdvChartView1.Panes[0].Series[0].AddSinglePoint(Random(100) + 10,
  ShortMonthNames[I + 1]);
end;

 Adding and removing series
Start the SerieEditorDialog and click on the - icon to remove or the + icon to add a series. You can add multiple series per pane. Here is an example to remove a series and to add a series to the first pane.
procedure TForm1.AddNewSerie;
var
  s: TChartSerie;
begin
  s := AdvChartView.Panes[0].Series.Add;
  // set properties of series here
end;
procedure TForm1.AddNewSerie;
var
  s: TAdvGDIPChartSerie;
begin
  s := AdvGDIPChartView.Panes[0].Series.Add;
  // set properties of GDI+ series here
end;
procedure TForm1.RemoveSerie;
begin
  AdvChartView.Panes[0].Series[0].Free;
end;

 Adding and removing a Pane
Open the Pane Editor dialog and click on the - icon to remove the selected pane. Click on the + icon to add a new pane. Below is a sample code snippet to add a pane:
procedure TForm1.AddNewPane;
var
  p: TAdvChartPane;
begin
  p := AdvChartView.Panes.Add;
  // set properties of Pane here
end;
procedure TForm1.AddNewPane;
var
  p: TAdvGDIPChartPane;
begin
  p := AdvGDIPChartView.Panes.Add;
  // set properties of GDI+ Pane here
end;
procedure TForm1.RemovePane;
begin
  AdvChartView.Panes[0].Free;
end;

 Linking a TAdvChartView with a TAdvStringGrid
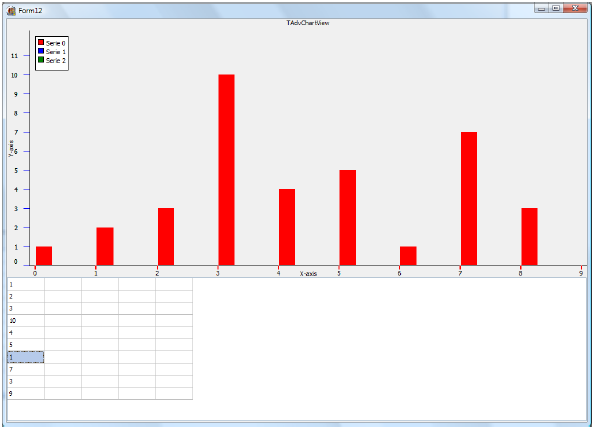
TAdvChartLink is a non-visual component and links a TAdvChartView with a TAdvStringGrid component. Please note that TAdvStringGrid is not included in TMS Advanced Charts. It is separately available at https://www.tmssoftware.com/site/advgrid.asp.
To start, drop a TAdvChartLink, TAdvChartView, TAdvStringGrid component on the form and set the Chartview and Grid properties in the TAdvChartLink component. To Edit the TAdvStringGrid set the goEditing property true in the Options set. The TAdvChartLink component has several properties. First the active property must be set true. To tell the TAdvChartLink which column in the grid will be used to display the data you must select an option from the DataType property.
For example select dtFullColumn. Then run the project and type your values in the first column of the grid. While typing, the chart will be updated.
Result:

 Using the pane,chart or annotations editors at runtime
To use the pane, chart or annotations editors at runtime simply drop the dialog component on the form, set the chart property to the TAdvChartView you want to edit and add the following code:
procedure TForm1.LoadPaneEditor;
begin
  AdvChartPanesEditorDialog.ChartView := AdvChartView1;
  AdvChartPanesEditorDialog.Execute;
end;

 Using the TAdvChartTypeSelector
The TAdvChartTypeSelector component is used in the Serie editor dialog to choose a different chart type. It can also be separately used. The component shows a mini representation of the chart type. You can drop several TAdvChartTypeSelector components on the form, select the chart type for each TAdvChartTypeSelector and add code to the ChartType MouseDown event to set the selector in Selected mode and get the chart type of the chart type selector.
Example:
procedure TForm1.ChartTypeSelector1MouseDown(Sender: TObject; Button: TMouseButton; Shift: TShiftState; X, Y: Integer);
begin
(Sender as TAdvChartTypeSelector).Selected := true;
AdvChartView.Panes[0].Series[0].ChartType := (Sender as TAdvChartTypeSelector).ChartType;
end;

 Adding points to a specific chart pane with a specific chart serie
TAdvChartView
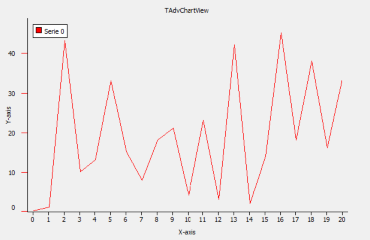
To visualize points the TAdvChartView component must be filled with values. Therefore the method AddSinglePoint adds points to a specific chart pane with a specific chart serie. After adding the points, set the Range of points you want to have visualized in the chart. In the sample below the range is set from 0 to 20 to display all 20 values. Note: Include the AdvChart Unit to use the value arEnabled for the AutoRange property as this type is defined in the unit AdvChart.
Example:
procedure TForm1.AddPoints;
var
  i: integer;
begin
  //Adds 20 Points with random value from 0 to 50 to the first Pane (0)
  //with the first Serie (0)
  for i := 0 to 20 do
  AdvChartView.Panes[0].Series[0].AddSinglePoint(RandomRange(0, 50));
  //Set Range from 0 to 20
  AdvChartView.Panes[0].Range.RangeFrom := 0;
  AdvChartView.Panes[0].Range.RangeTo := 20;
  //Set Auto Display Range to arEnabled
  AdvChartView.Panes[0].Series[0].Autorange := arEnabled;
end;
TAdvChartViewGDIP (GDI +)
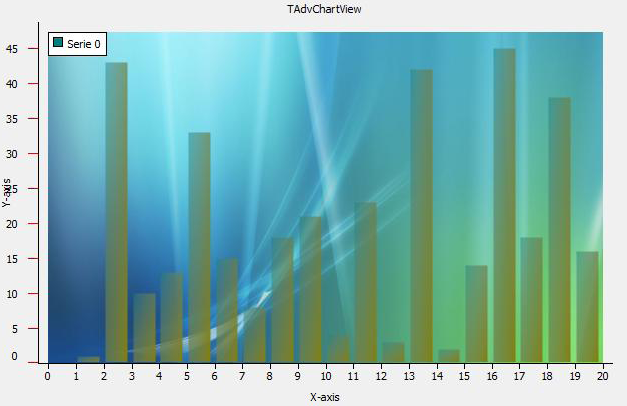
To visualize points, use the same method for adding points as for the TAdvChartView component. To use transparency and complex gradients add a TAdvChartViewGDIP component to the form and add the code below. Add Unit AdvChartUtil to the Uses clause. The best way to see the transparency is to add a Background image.
Example:
procedure TForm1.GDIPGraphics;
begin
  //Adds Gradient start color and Gradient end color with a Forward
  //Diagonal Gradient type. The starting Transparency is 120 and the end
  //transparency is 255;
  AdvGDIPChartView.Panes[0].Series[0].Color := clTeal;
  AdvGDIPChartView.Panes[0].Series[0].ColorTo := clOlive;
  AdvGDIPChartView.Panes[0].Series[0].Opacity := 120;
  AdvGDIPChartView.Panes[0].Series[0].Opacity := 255;
  AdvGDIPChartView.Panes[0].Series[0].GradientType := gtForwardDiagonal;
end;

 Applying a 3D effect to chart series
It is possible to apply a 3D effect on the chart serie. This effect can be customized with a 3D Offset property. This is a property that controls the depth of the 3D view. In code, the equivalent to do this is:
AdvChartView.Panes[PaneIndex].Series[SerieIndex].3D := true;
AdvChartView.Panes[PaneIndex].Series[SerieIndex].3DOffset := 20;
- ctLine
- ctStackedBar & ctNormalBar
- ctStackedArea & ctNormalArea
- ctBand
- ctLineHistogram
- ctLineBar
- ctStackedPercentagebar
- ctStackedPercentageArea

 Visual organisation of TMS Advanced Charts
TAdvChartView consists of multipane charts. This means that the chartview can have one or more panes and each pane can display a chart with a single or multiple series. The charts on the panes can scroll and zoom synchronously or can also do this independent of each other. The panes of the chartview are accessible through the component‘s Pane collection. The major elements of the chart are indicated on this screenshot:
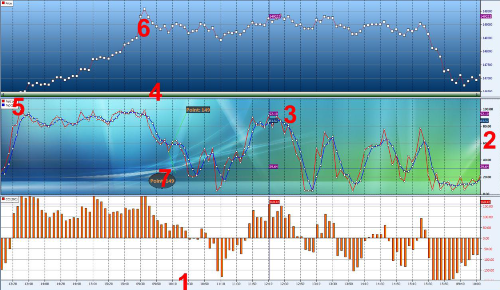
1: X–axis:
Displays the range of points in the chart in number format, a date/time format with unit types minute, day, month, year, custom drawn values or specified values per point. The X-axis supports scaling with mouse. Include poHorizontalScaling in Pane.Options property, then click and drag mouse left or right to see more or less points.
2: Y–axis:
Displays the range of series values from a defined minimum to maximum or via Autorange the best range can automatically be choosen. The Y-axis supports scaling with the mouse and/or keyboard. Include poVerticalScaling in Pane.Options property, then click and drag mouse up or down or press Shift Up/Down to expand or reduce the maximum and minimum value. The Y-axis can be set at the left side of the chart, the right side of the chart or both sides. Different Y-axis values can be shown for different series. The Y-axis also has the capability to show major & minor units with a different font.
3: Crosshairs:
When crosshairs are enabled, move the mouse in the pane area and values which intersect with the crosshair are shown either in the Y-axis area, at the crosshair intersection point, in a separate tracker window or the values can be programmatically retrieved to display in another control.
4: Navigator:
Enable the navigator to scroll left or right in the chart pane. The navigator also offers the same capability as the X–axis itself to zoom in/out.
5: Legend:
Displays the legend text for the number of current chart series added to the chart pane.
6: ChartType:
Choose a chart type and add markers to mark the Y–value of the point.
7: Annotations:
Add an annotation to add text to important points in the serie.
When a New TAdvChartView component is dropped on the form, the component contains one pane with 3 series. Double-click the TAdvChartView component to popup the pane editor that allows adding and removing series from the pane.

 Simple XY chart Demo
This sample demonstrates a simple XY scatter demo, with properties set to
display the X-values below the main X-Axis as well as displaying the points on a specific
(X, Y) point between RangeFrom and RangeTo.
http://www.tmssoftware.net/public/XYScatterDemo.zip

 XY chart in combination with DateTime X-Axis
With the release of the new XY Line and Marker chart, we have added the possibility to add a range of datetimes on specific intervals between the RangeFrom and RangeTo.
We have uploaded a sample for you to investigate:
XY DateTime Demo

 Updating Chart at runtime
When updating the chart component at runtime it is important to "tell" the chart to update itself.
Whenever you change properties, or add/remove points the chart will not be updated.
This is because the chart will be repainted over and over again every time you change a property.
This would cause a slow performance.
To update the chart at runtime, after you change properties, you must use the BeginUpdate / EndUpdate methods.
Sample: Updating a series of points at runtime
procedure TForm1.Button1Click(Sender: TObject);
begin
  AdvChartView1.BeginUpdate;
  with AdvChartView1.Panes[0].Series[0] do
  begin
    Points[0].SingleValue := 100;
    Points[1].SingleValue := 50;
    Points[2].SingleValue := 20;
    Points[3].SingleValue := 30;
    Points[4].SingleValue := 150;
    Points[5].SingleValue := 160;
  end;
  AdvChartView1.EndUpdate;
end;
 Modifying a single series data point value in code
If a data value changes after it was added to the series, it is easy to update the value at a later time via code. To do this, it is required to know the index of the pane, the index of the series and the index of the data point in the series. This example code snippet changes the third datapoint of first serie in the first pane of the chart:
AdvChartView1.BeginUpdate;
AdvChartView1.Panes[0].Series[0].Points[2].SingleValue := Random(100);
AdvChartView1.EndUpdate;

 Retrieving the serie values at crosshair
While the tracker window will display serie values at crosshair position, it can often be interesting to retrieve the values in code. Following code snippet shows the serie values in the caption of the form:
procedure TForm1.AdvChartView1MouseMove(Sender: TObject; Shift: TShiftState;
  X, Y: Integer);
var
  i: integer;
  cp: TChartPoint;
  s: string;
begin
  with AdvChartView1.Panes[0] do
  begin
    s := '';
    for i := 0 to Series.Count - 1 do
    begin
      cp := GetChartPointAtCrossHair(i);
      if s = '' then
        s := floattostr(cp.SingleValue)
      else
        s := s + ':' + floattostr(cp.SingleValue);
    end;
  end;
end;
 Programmatically scrolling and zooming in the chart
Scrolling and zooming via code in the chart is simple. This is just a matter of programmatically changing the properties Pane.Range.RangeFrom and Pane.Range.RangeTo. To illustrate this, we create a single sinus serie in a chart and add 4 buttons to control the scrolling & zooming:
Initialization of the chart:
procedure TForm1.FormCreate(Sender: TObject);
var
  i: integer;
begin
  advchartview1.BeginUpdate;
  advchartview1.Panes.Clear;
  advchartview1.Panes.Add;
  advchartview1.Panes[0].Options := advchartview1.Panes[0].Options + [poMoving, poHorzScroll, poHorzScale];
  advchartview1.Panes[0].Series.Add;

  with advchartview1.Panes[0].Series[0] do
  begin
    for i := 1 to 200 do
      AddSinglePoint(50 * sin(i/20*PI));
  end;
  advchartview1.Panes[0].Series[0].AutoRange := arCommon;
  advchartview1.Panes[0].Range.RangeFrom := 0;
  advchartview1.Panes[0].Range.RangeTo := 200;

  advchartview1.EndUpdate;
end;procedure TForm1.Scroll(delta: integer); begin advchartview1.BeginUpdate; advchartview1.Panes[0].Range.RangeFrom := advchartview1.Panes[0].Range.RangeFrom + delta; advchartview1.Panes[0].Range.RangeTo := advchartview1.Panes[0].Range.RangeTo + delta; advchartview1.EndUpdate; end; procedure TForm1.Zoom(delta: integer); begin advchartview1.BeginUpdate; advchartview1.Panes[0].Range.RangeFrom := advchartview1.Panes[0].Range.RangeFrom + delta; advchartview1.Panes[0].Range.RangeTo := advchartview1.Panes[0].Range.RangeTo - delta; advchartview1.EndUpdate; end;
procedure TForm1.ScrollLeftClick(Sender: TObject);
begin
  Scroll(-10);
end;

procedure TForm1.ScrollRightClick(Sender: TObject);
begin
  Scroll(+10);
end;

procedure TForm1.ZoomOutClick(Sender: TObject);
begin
  Zoom(+10);
end;

procedure TForm1.ZoomInClick(Sender: TObject);
begin
  Zoom(-10);
end;

 Using Y-axis values per serie in the chart
Each serie in the chart can have its own Y-axis values. It can be choosen if the Y-axis values for a series should be displayed left or right from the chart. The settings to control this are under Serie.YAxis.Position. When two series have an Y-axis displayed on the same size of the chart, the spacing between the Y-axis itself and value is controlled by Serie.YAxis.MajorUnitSpacing := 30;
In the code sample below, 4 series are added to the chart. Series 1 and 3 have the Y-axis on the left side while series 2 and 4 have the Y-axis on the right side. To make clear what Y-axis belongs to what series, the serie line color is set to the same color as the Y-axis value font.
procedure TForm2.InitChart;
begin
  advchartview1.BeginUpdate;
  advchartview1.Panes[0].Series.Clear;

  with advchartview1.Panes[0].Series.Add do
  begin
    YAxis.Position := yLeft;
    YAxis.MajorUnitSpacing := 30;
    YAxis.MajorFont.Color := clRed;
    AddSinglePoint(0);
    AddSinglePoint(15);
    AddSinglePoint(17);
    AddSinglePoint(18);
    LineColor := clRed;
    AutoRange := arEnabled;
  end;

  with advchartview1.Panes[0].Series.Add do
  begin
    YAxis.Position := yRight;
    YAxis.MajorUnitSpacing := 30;
    YAxis.MajorFont.Color := clGreen;
    AddSinglePoint(150);
    AddSinglePoint(100);
    AddSinglePoint(120);
    AddSinglePoint(190);
    LineColor := clGreen;
    AutoRange := arEnabled;
  end;

  with advchartview1.Panes[0].Series.Add do
  begin
    YAxis.Position := yLeft;
    YAxis.MajorFont.Color := clBlue;
    AddSinglePoint(20);
    AddSinglePoint(25);
    AddSinglePoint(27);
    AddSinglePoint(28);
    LineColor := clBlue;
    AutoRange := arEnabled;
  end;

  with advchartview1.Panes[0].Series.Add do
  begin
    YAxis.Position := yRight;
    YAxis.MajorFont.Color := clYellow;
    AddSinglePoint(250);
    AddSinglePoint(200);
    AddSinglePoint(210);
    AddSinglePoint(380);
    LineColor := clYellow;
    AutoRange := arEnabled;
  end;

  advchartview1.Panes[0].YAxis.Position := yBoth;
  advchartview1.Panes[0].YAxis.Size := 150;
  advchartview1.Panes[0].Range.RangeFrom := 0;
  advchartview1.Panes[0].Range.RangeTo := 3;
  advchartview1.EndUpdate;
end;
 Add custom X-axis text programmatically
With the latest version of the TAdvChartView component it is possible to add custom X-Axis text by a new override of the AddSinglePoint method that has a parameter XAxisText.
The sample code snippet here shows how to add a custom numbering as X-axis label text rotated by 40°.
procedure TForm.FormCreate(Sender: TObject);
var
  i: integer;
  xval: Double;
begin
  with AdvChartView1.Panes[0] do
  begin
    //Set range
    Range.RangeFrom := 0;
    Range.RangeTo := 100;
    Range.MaximumScrollRange := 100;
    Range.MinimumScrollRange := 0;
    //Set X-Axis size
    XAxis.Size := 60;
    //Add points with custom X-Axis text
    with Series[0] do
    begin
      ChartType := ctBar;
      AutoRange := arEnabledZeroBased;
      Color := clBlue;
      ColorTo := clSilver;
      for I := 0 to 100 do
      begin
        xval := 144 + (I * 0.2);
        AddSinglePoint(RandomRange(20, 100),  FloatToStr(xval));
      end;

      //Rotate text
      XAxis.TextBottom.Angle := 40;
      //Enabled tickmarks
      XAxis.TickMarkColor := clBlack;
    end;
  end;

 Add custom X-axis values via an event
To override the standard X-axis values drawn by TAdvChartView an event OnXAxisDrawValue event is available for each serie. To add an event handler for OnXAxisDrawValue, declare a procedure and assign it to the serie.OnXAxisDrawValue event like in the code snippet below:
AdvChartView.Panes[0].Series[0].OnXAxisDrawValue := XAxisDrawValue;

procedure TForm.XAxisDrawValue(Sender: TObject; Serie: TChartSerie;
  Canvas: TCanvas; ARect: TRect; ValueIndex, XMarker: integer; Top: Boolean;
  var defaultdraw: Boolean);
begin
  //Insert Code here
end;
The technique illustrated with following sample. Some points were added in a serie and for each odd value on the X-Axis we want to display a Car brand in the X-axis:
procedure TForm.XAxisDrawValue(Sender: TObject; Serie: TChartSerie;
  Canvas: TCanvas; ARect: TRect; ValueIndex, XMarker: integer; Top: Boolean;
  var defaultdraw: Boolean);

const
  lst: array[0..4] of String = ('Audi', 'BMW', 'Mercedes', 'Bugatti', 'Porsche');
var
  s: String;
  th, tw: integer;
begin
  if Odd(ValueIndex) then
  begin
    Canvas.Font.Size := 12;
    s := lst[Random(Length(lst))];
    th := Canvas.TextHeight(s);
    tw := Canvas.TextWidth(s);
    Canvas.TextOut(Xmarker - (tw div 2), ARect.Top + th, s);
  end;
end;
Compatibility
- Delphi 7, 2007, 2010, 2009, XE, XE2, XE3, XE4, XE5, XE6, XE7, XE8, 10 Seattle, 10.1 Berlin, 10.2 Tokyo, 10.3 Rio, 10.4 Sydney, 11 Alexandria, C++Builder 2007, 2009, 2010, XE, XE2, XE3, XE4, XE5, XE6, XE7, XE8, 10 Seattle, 10.1 Berlin, 10.2 Tokyo, 10.3 Rio, 10.4 Sydney, 11 Alexandria, DXE15, CXE15 (Professional/Enterprise/Architect)
Licensing
- Licensing FAQ
- License for commercial use: Single developer license, Small team license, Site license
- Includes full source code
- Ask questions to our engineers related to purchased product via Support Center
- Free 1 year updates and new releases
- After 1 year, a discount renewal is offered for a 1 year extension. *
* offer valid for 30 days after end of license. Discount price is subject to change.