IW
TMS IntraWeb Charts
Fast multipane financial graphs & 2D feature rich charting
Also available for:
Tips and Frequently Asked Questions

 Customizing the drawing of the markers.
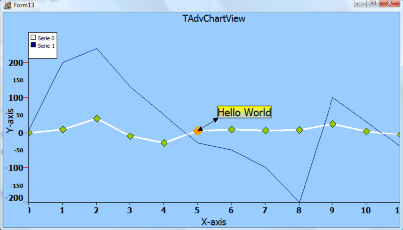
A marker can be selected. Set the SelectedColor and the SelectedSize property. Click on the marker at runtime, the marker will be shown in the selected color & size. To add code when a marker is clicked you can use the SerieMouseDown or SerieMouseUp event. This can be used for example to add an annotation at a specific point of the series.

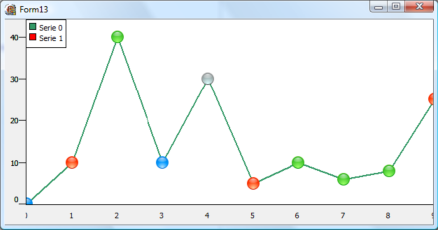
It is possible to customize the drawing of the markers. Select mCustom as marker type and use the event OnMarkerDrawValue. Follow sample code snippet shows how this can be done:
type
  TForm1 = class(TForm)
  private
     { private declarations }
  public
     { public declarations }
    procedure DrawMarker(Sender: TObject; Serie: TChartSerie; Canvas: TCanvas; X, Y,Point: integer; value: TChartPoint);
end;AdvChartview.Panes[0].Series[0].OnMarkerDrawValue := DrawMarker;


Compatibility
- Delphi 7, 2007, 2010, 2009, XE, XE2, XE3, XE4, XE5, XE6, XE7, XE8, 10 Seattle, 10.1 Berlin, 10.2 Tokyo, 10.3 Rio, 10.4 Sydney, 11 Alexandria, C++Builder 2007, 2009, 2010, XE, XE2, XE3, XE4, XE5, XE6, XE7, XE8, 10 Seattle, 10.1 Berlin, 10.2 Tokyo, 10.3 Rio, 10.4 Sydney, 11 Alexandria, DXE15, CXE15 (Professional/Enterprise/Architect)
Licensing
- Licensing FAQ
- License for commercial use: Single developer license, Small team license, Site license
- Includes full source code
- Ask questions to our engineers related to purchased product via Support Center
- Free 1 year updates and new releases
- After 1 year, a discount renewal is offered for a 1 year extension. *
* offer valid for 30 days after end of license. Discount price is subject to change.