IW
TMS IntraWeb Charts
Fast multipane financial graphs & 2D feature rich charting
Also available for:
Tips and Frequently Asked Questions

 Programmatic use of DBAdvChartView & TDBAdvGDIPChartView
Below is a code sample to show values from a Microsoft Access Database, using an AdoDataSet, AdoConnection and a Datasource.
Drop a TDBAdvGDIPChartView, TAdoConnection, TAdoTable and a TDataSource on the form. Insert this code in the procedure FormCreate:
procedure TForm1.FormCreate(Sender: TObject);
var
  I: integer;
begin
  DBAdvGDIPChartView1.Panes[0].BorderColor := clBlack;
  DBAdvGDIPChartView1.Panes[0].BorderWidth := 3;

  with DBAdvGDIPChartView1.Panes[0] do
  begin
    Series.Clear;
    //Set connection string to database
    ADOConnection1.ConnectionString :=
'Provider=Microsoft.Jet.OLEDB.4.0;Data
Source=sales.mdb;Persist Security Info=False';
    ADOConnection1.Connected := true;

    //Set tablename
    ADOTable1.Connection := ADOConnection1;
    ADOTable1.TableName := 'Sales';

    //link to Datasource and datasource to chart
    DataSource1.DataSet := ADOTable1;
    //Datasource property of Chart
    DataSource := DataSource1;

    XAxis.Position := xNone;
    YAxis.Position := yNone;
    Title.Color := RGB(255, 255, 210);
    Title.ColorTo := RGB(255, 255, 210);
    Title.BorderColor := clBlack;
    Title.BorderWidth := 1;
    Title.GradientDirection := cgdVertical;
    Title.Size := 50;
    Title.Text := 'Database Spider Chart';
    Title.Font.Size := 14;
    Title.Font.Style := [fsBold];
    Background.GradientType := gtHatch;
    Background.HatchStyle := HatchStyleWideDownwardDiagonal;
    Background.Color := RGB(255, 255, 210);
    BackGround.ColorTo := clWhite;
    Legend.Visible := false;
    Margin.LeftMargin := 0;
    Margin.rightMargin := 0;
    Margin.TopMargin := 0;
    series.DonutMode := dmStacked;

    YAxis.AutoUnits := false;
    YGrid.MajorDistance := 50;
    YGrid.MinorDistance := 10;
    YGrid.MinorLineColor := clSilver;
    YGrid.MajorLineColor := clDkGray;
    YGrid.MinorLineStyle := psDash;

    Series.Add;

    with Series[0] do
    begin
      Pie.LegendOffsetTop := (Self.Height div 2) - 150;
      Pie.LegendColor := clRed;
      Color := clRed;
      FieldNameValue := 'Product X';
      FieldNameXAxis := 'Sales by Region';
      LegendText := 'Product X';
      Pie.LegendTitleColor := clRed;
      Pie.ValueFont.Color := clRed;
    end;

    Series.Add;

    with Series[1] do
    begin
      Pie.LegendOffsetTop := (Self.Height div 2);
      Pie.LegendColor := clGreen;
      Color := clGreen;
      Pie.ShowGrid := false;
      YAxis.Visible := false;
      FieldNameValue := 'Product Y';
      FieldNameXAxis := 'Sales by Region';
      LegendText := 'Product Y';
      Pie.LegendTitleColor := clGreen;
      Pie.ValueFont.Color := clGreen;
    End;

    Series.Add;

    with Series[2] do
    begin
      Pie.LegendOffsetTop := (Self.Height div 2) + 150;
      Pie.LegendColor := clBlue;
      Color := clBlue;
      Pie.ShowGrid := false;
      YAxis.Visible := false;
      FieldNameValue := 'Combined';
      FieldNameXAxis := 'Sales by Region';
      LegendText := 'Combined';
      Pie.LegendTitleColor := clBlue;
      Pie.ValueFont.Color := clBlue;
    end;

    for I := 0 to Series.Count - 1 do
    begin
      with Series[I] do
      begin
        YAxis.MajorUnit := 50;
        YAxis.MajorUnit := 25;
        Pie.LegendTitleVisible := true;
        Pie.LegendOpacity := 50;
        Pie.LegendOpacityto := 0;
        Pie.LegendTitleOpacity := 50;
        Pie.LegendGradientType := gtForwardDiagonal;
        Pie.LegendBorderColor := clBlack;
        Pie.Position := spCustom;
        Pie.Left := self.Width div 3;
        Pie.Top := self.Height div 2;
        Pie.LegendFont.Size := 10;
        ValueFormat := '$%g,000';
        Pie.ValueFont.Size := 10;
        ChartType := ctSpider;
        Opacity := 50;
        LineColor := clBlack;
        AutoRange := arCommonZeroBased;
        Pie.Size := 400;
        Pie.ShowValues := true;
        Pie.ValuePosition := vpOutSideSlice;
        Pie.LegendPosition := spCustom;
        Pie.LegendOffsetLeft := Self.Width - 150;
      end;
    end;
     // open connection
    ADOTable1.Active := true;
  end;
end;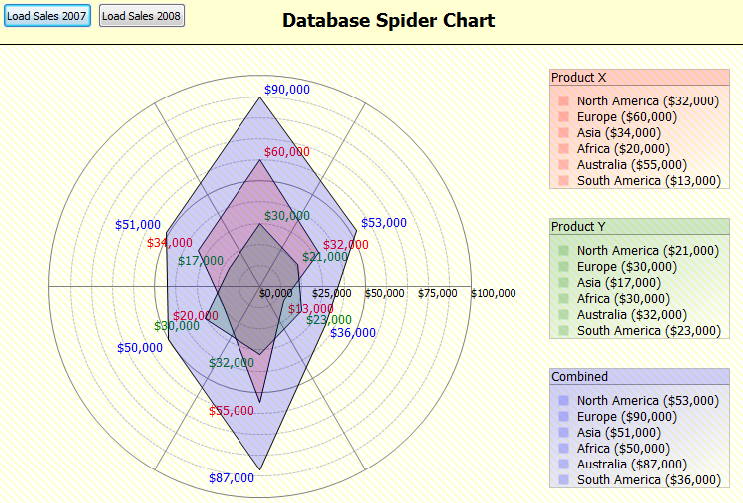

Compatibility
- Delphi 7, 2007, 2010, 2009, XE, XE2, XE3, XE4, XE5, XE6, XE7, XE8, 10 Seattle, 10.1 Berlin, 10.2 Tokyo, 10.3 Rio, 10.4 Sydney, 11 Alexandria, C++Builder 2007, 2009, 2010, XE, XE2, XE3, XE4, XE5, XE6, XE7, XE8, 10 Seattle, 10.1 Berlin, 10.2 Tokyo, 10.3 Rio, 10.4 Sydney, 11 Alexandria, DXE15, CXE15 (Professional/Enterprise/Architect)
Licensing
- Licensing FAQ
- License for commercial use: Single developer license, Small team license, Site license
- Includes full source code
- Ask questions to our engineers related to purchased product via Support Center
- Free 1 year updates and new releases
- After 1 year, a discount renewal is offered for a 1 year extension. *
* offer valid for 30 days after end of license. Discount price is subject to change.