TMS IntraWeb Charts
Fast multipane financial graphs & 2D feature rich charting
Also available for:
Tips and Frequently Asked Questions

 Visual organisation of TMS Advanced Charts
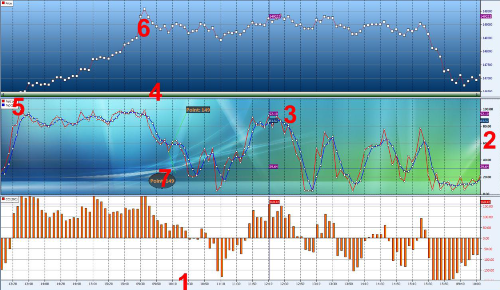
TAdvChartView consists of multipane charts. This means that the chartview can have one or more panes and each pane can display a chart with a single or multiple series. The charts on the panes can scroll and zoom synchronously or can also do this independent of each other. The panes of the chartview are accessible through the component‘s Pane collection. The major elements of the chart are indicated on this screenshot:

1: X–axis:
Displays the range of points in the chart in number format, a date/time format with unit types minute, day, month, year, custom drawn values or specified values per point. The X-axis supports scaling with mouse. Include poHorizontalScaling in Pane.Options property, then click and drag mouse left or right to see more or less points.
2: Y–axis:
Displays the range of series values from a defined minimum to maximum or via Autorange the best range can automatically be choosen. The Y-axis supports scaling with the mouse and/or keyboard. Include poVerticalScaling in Pane.Options property, then click and drag mouse up or down or press Shift Up/Down to expand or reduce the maximum and minimum value. The Y-axis can be set at the left side of the chart, the right side of the chart or both sides. Different Y-axis values can be shown for different series. The Y-axis also has the capability to show major & minor units with a different font.
3: Crosshairs:
When crosshairs are enabled, move the mouse in the pane area and values which intersect with the crosshair are shown either in the Y-axis area, at the crosshair intersection point, in a separate tracker window or the values can be programmatically retrieved to display in another control.
4: Navigator:
Enable the navigator to scroll left or right in the chart pane. The navigator also offers the same capability as the X–axis itself to zoom in/out.
5: Legend:
Displays the legend text for the number of current chart series added to the chart pane.
6: ChartType:
Choose a chart type and add markers to mark the Y–value of the point.
7: Annotations:
Add an annotation to add text to important points in the serie.
When a New TAdvChartView component is dropped on the form, the component contains one pane with 3 series. Double-click the TAdvChartView component to popup the pane editor that allows adding and removing series from the pane.

Compatibility
- Delphi 7, 2007, 2010, 2009, XE, XE2, XE3, XE4, XE5, XE6, XE7, XE8, 10 Seattle, 10.1 Berlin, 10.2 Tokyo, 10.3 Rio, 10.4 Sydney, 11 Alexandria, C++Builder 2007, 2009, 2010, XE, XE2, XE3, XE4, XE5, XE6, XE7, XE8, 10 Seattle, 10.1 Berlin, 10.2 Tokyo, 10.3 Rio, 10.4 Sydney, 11 Alexandria, DXE15, CXE15 (Professional/Enterprise/Architect)
Licensing
- Licensing FAQ
- License for commercial use: Single developer license, Small team license, Site license
- Includes full source code
- Ask questions to our engineers related to purchased product via Support Center
- Free 1 year updates and new releases
- After 1 year, a discount renewal is offered for a 1 year extension. *
* offer valid for 30 days after end of license. Discount price is subject to change.