Frequently Asked Component Specific Questions
Options |
|
Display all FAQ items |
Displaying items 136 to 150 of 888, page 10 of 60
<< previous next >>

 TMS VCL WebGMaps
Increase maximum number of allowed waypoints when using GetDirections
The number of waypoints is limited to 8. When an API key is assigned, up to 23 waypoints are allowed. This is a limitation of the Google Directions API which we have no control over.
Example:
WebGMaps1.APIKey := ''abc'';
https://developers.google.com/maps/documentation/directions/usage-limits
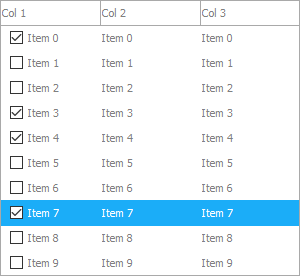
TAdvTreeViewMulti-column checked listbox via TAdvCheckedTreeView
procedure TForm1.FormCreate(Sender: TObject);
var
  c: TAdvTreeViewColumn;
  n: TAdvTreeViewNode;
  I: Integer;
begin
  AdvCheckedTreeView1.BeginUpdate;
  AdvCheckedTreeView1.Columns.Clear;
  c := AdvCheckedTreeView1.Columns.Add;
  c.Text := ''Col 1'';
  c := AdvCheckedTreeView1.Columns.Add;
  c.Text := ''Col 2'';
  c := AdvCheckedTreeView1.Columns.Add;
  c.Text := ''Col 3'';

  AdvCheckedTreeView1.Nodes.Clear;
  AdvCheckedTreeView1.NodesAppearance.LevelIndent := 0;
  AdvCheckedTreeView1.NodesAppearance.ExpandWidth := 0;
  AdvCheckedTreeView1.NodesAppearance.ExpandHeight := 0;
  AdvCheckedTreeView1.NodesAppearance.ShowLines := False;
  AdvCheckedTreeView1.NodesAppearance.SelectionArea := tsaFull;

  for I := 0 to 9 do
  begin
    n := AdvCheckedTreeView1.Nodes.Add;
    n.CheckTypes[0] := tvntCheckBox;
    n.Text[0] := ''Item '' + inttostr(I);
    n.Text[1] := ''Item '' + inttostr(I);
    n.Text[2] := ''Item '' + inttostr(I);
  end;
  AdvCheckedTreeView1.EndUpdate;
end;
 TAdvTreeView
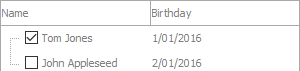
Using the DataObject
The DataObject can hold any object you like, but you are responsible for cleaning up any references to avoid memory leaks.
A typical use:
type
  TPerson = class
    FName: string;
    FBirthDay: TDateTime;
  public
    constructor Create(AName: string; ABirthDay: TDateTime);
    property Name: string read FName;
    property BirthDay: TDateTime read FBirthDay;
  end;

...

implementation

...

procedure TForm1.FormCreate(Sender: TObject);
var
  I: Integer;
  n: TAdvCheckedTreeViewNode;
begin
  FPersons := TObjectList<TPerson>.Create;
  FPersons.Add(TPerson.Create(''Tom Jones'', EncodeDate(2016, 1, 1)));
  FPersons.Add(TPerson.Create(''John Appleseed'', EncodeDate(2016, 1, 2)));

  AdvCheckedTreeView1.Nodes.Clear;
  AdvCheckedTreeView1.Columns[0].Text := ''Name'';
  AdvCheckedTreeView1.Columns.Add.Text := ''Birthday'';
  for I := 0 to FPersons.Count - 1 do
  begin
    n := TAdvCheckedTreeViewNode(AdvCheckedTreeView1.Nodes.Add);
    n.Text[0] := FPersons[I].Name;
    n.Text[1] := DateToStr(FPersons[I].Birthday);
    n.CheckTypes[0] := tvntCheckBox;
    n.DataObject := FPersons[I];
  end;
end;

{ TPerson }

constructor TPerson.Create(AName: string; ABirthDay: TDateTime);
begin
  FName := AName;
  FBirthday := ABirthDay;
end;

procedure TForm1.FormDestroy(Sender: TObject);
begin
  FPersons.Free;
end;
procedure TForm1.AdvCheckedTreeView1AfterCheckNode(Sender: TObject;
  ANode: TAdvTreeViewVirtualNode; AColumn: Integer);
var
  p: TPerson;
begin
  if Assigned(ANode.Node) and Assigned(ANode.Node.DataObject) then
    p := TPerson(ANode.Node.DataObject);
end;
 TAdvStringGrid
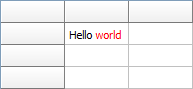
Changing the font color of a part of the text in a grid cell using rich text
Example:
begin
  AdvStringGrid1.Cells[1,1] := ''Hello world'';
  AdvStringGrid1.CellToRich(1,1, AdvStringGrid1.RichEdit);

  AdvStringGrid1.RichEdit.SelStart := 6;
  AdvStringGrid1.RichEdit.SelLength := 5;
  AdvStringGrid1.RichEdit.SelAttributes.Color := clRed;

  AdvStringGrid1.RichToCell(1,1, AdvStringGrid1.RichEdit);
end;
 TAdvStringGrid
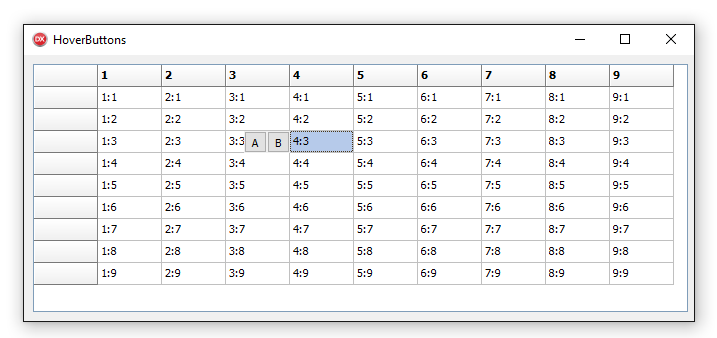
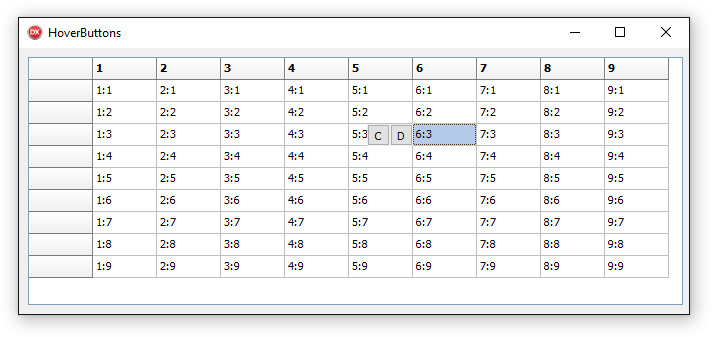
Using the OnHoverButtonsShow event to configure different hover buttons for different columns
To do this, enable HoverButtons and implement the OnHoverButtonsRow event that is triggered when the mouse hovers a cell. Here it is possible to control whether hover buttons are shown with the Allow event parameter and from this event, the grid.HoverButtons property can be used to customize hover buttons per cell.
The code to show different hover buttons only for column 4 and 6 is therefore:
procedure TForm1.AdvStringGrid1HoverButtonsShow(Sender: TObject; X, Y: Integer;
  var Allow: Boolean);
var
  c,r: integer;
begin
  AdvStringGrid1.MouseToCell(x,y,c,r);

 if c = 4 then
  begin
    // configure hover buttons here for column 4
    AdvStringGrid1.HoverButtons.Buttons[0].Caption := ''A'';
    AdvStringGrid1.HoverButtons.Buttons[1].Caption := ''B'';
    AdvStringGrid1.HoverButtons.Column := 4;
  end
  else
  if c = 6 then
  begin
    // configure hover buttons here for column 6
    AdvStringGrid1.HoverButtons.Buttons[0].Caption := ''C'';
    AdvStringGrid1.HoverButtons.Buttons[1].Caption := ''D'';
    AdvStringGrid1.HoverButtons.Column := 6;
  end
  else
    Allow := false;

end;

procedure TForm1.FormCreate(Sender: TObject);
begin
  AdvStringGrid1.HoverButtons.Enabled := true;
  AdvStringGrid1.HoverButtons.Buttons.Clear;
  AdvStringGrid1.HoverButtons.Buttons.Add.Caption := ''0'';
  AdvStringGrid1.HoverButtons.Buttons.Add.Caption := ''1'';
  AdvStringGrid1.AutoNumberRow(0);
  AdvStringGrid1.LinearFill(false);
end;
 TPlanner
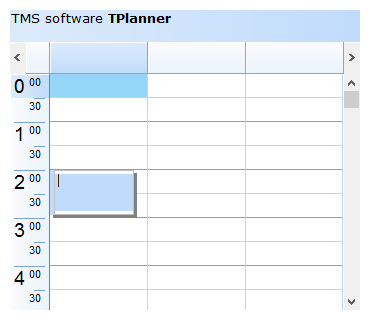
How to create programatically a plannerItem and start an ItemEditor
Example:
var
  plit: TPlannerItem;
begin
  plit := planner1.CreateItem;
  plit.itembegin := 4;
  plit.itemend := 6;
  plit.itempos := 0;
  plIt.Edit;
end;
Delphi 10.1 Berlin Starter Edition support
As Embarcadero disables the command-line compiling in a starter edition, our automatic installer invoking this command-line compiler cannot compile the component sources for you upon installation. Therefore, we included a project group file especially for the Delphi 10.1 Berlin Starter Edition that allows you to install the components in the IDE. After running the installer and have it extract all sources, open the group tmsdXE10startergroup.groupproj from the IDE and compile & install each package in this group from the project manager in the IDE.
TMS VCL Cloud PackRegistering an application for using a cloud service
The latest information for signing up and registering your application for using a cloud service can be found here: https://www.tmssoftware.com/site/cloudkey.asp
TAdvColumnGridColumn setup after import for XLS, XLSX files with TAdvGridExcelIO or TMS Grid Filters
After importing an .XLS or .XLSX file with TAdvGridExcelIO or with TMS Grid Filters interface to TMS Flexcel, make sure to call Grid.Columns.SetOrganization; to make sure the column organisation is properly initialized after loading the .XLS or .XLSX file.
TMS VCL WebGMapsGoogle Maps direction API usage limits
Google imposes some limitations on the use of their Google Maps directions API. The place where you can find about these usage limitations is here: https://developers.google.com/maps/documentation/directions/usage-limits
TMS FMX Cloud PackTTMSFMXPayPal: How to process a test payment
The TTMSFMXPayPal control supports the Sandbox environment from the PayPal API that allows processing test payments. Make sure the APIEnvironment property is set to peSandbox and that you are using a Sandbox account. You can find/create Sandbox accounts at the PayPal developers page.
 TMS FMX Chart
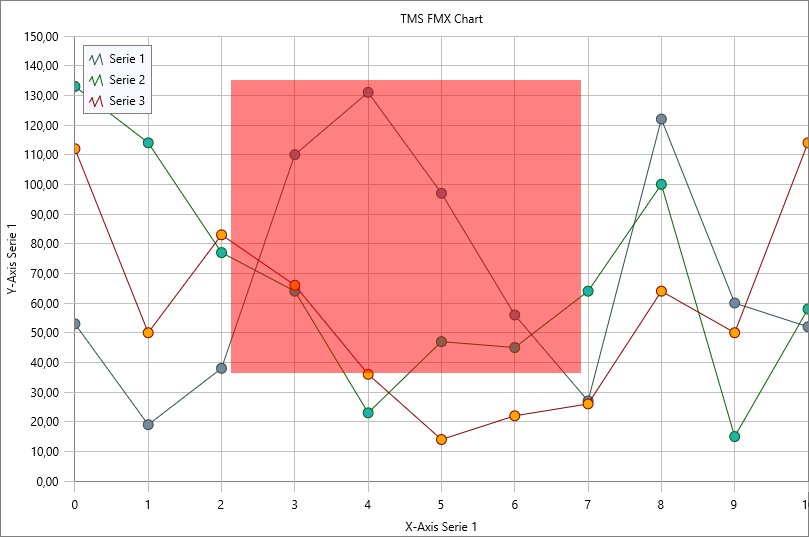
Zooming
The zooming functionality like in the VCL version is not implemented yet. We will add this on our feature request list, but as a starting point we have included a sample that allows you to write an own implementation. To test this code below after implementation, hold the CTRL key on the keyboard, click on the chart and drag down/right to zoom in to a specific area.
private
    { Private declarations }
    FDragArea: Boolean;
    FDragDownPos, FDragMovePos: TPointF;

....

procedure TForm1.FormCreate(Sender: TObject);
begin
  TMSFMXChart1.InteractionOptions.ScaleMode := smNone;
end;

procedure TForm1.TMSFMXChart1AfterDrawChart(Sender: TObject; ACanvas: TCanvas; ARect: TRectF);
begin
  if FDragArea then
  begin
    ACanvas.Fill.Color := claRed;
    ACanvas.FillRect(RectF(FDragDownPos.X, FDragDownPos.Y, FDragMovePos.X, FDragMovePos.Y), 0, 0, AllCorners, 0.5);
  end;
end;

procedure TForm1.TMSFMXChart1MouseDown(Sender: TObject; Button: TMouseButton; Shift: TShiftState; X, Y: Single);
begin
  FDragArea := (ssCtrl in Shift);
  FDragDownPos := PointF(X, Y);
end;

procedure TForm1.TMSFMXChart1MouseMove(Sender: TObject; Shift: TShiftState; X, Y: Single);
begin
  if FDragArea then
  begin
    FDragMovePos := PointF(X, Y);
    TMSFMXChart1.Repaint;
  end;
end;

procedure TForm1.TMSFMXChart1MouseUp(Sender: TObject; Button: TMouseButton; Shift: TShiftState; X, Y: Single);
var
  I: Integer;
begin
  if FDragArea then
  begin
    for I := 0 to TMSFMXChart1.Series.Count - 1 do
    begin
      TMSFMXChart1.Series[I].AutoXRange := arDisabled;
      TMSFMXChart1.Series[I].AutoYRange := arDisabled;
      TMSFMXChart1.Series[I].MinX := TMSFMXChart1.Series[I].XToValue(FDragDownPos.X);
      TMSFMXChart1.Series[I].MaxX := TMSFMXChart1.Series[I].XToValue(X);
      TMSFMXChart1.Series[I].MinY := TMSFMXChart1.Series[I].YToValue(Y);
      TMSFMXChart1.Series[I].MaxY := TMSFMXChart1.Series[I].YToValue(FDragDownPos.Y);
    end;

    FDragArea := False;
  end;
end;
 TMS FMX Chart
Dynamically pass an array of points
With the OnGetNumberOfPoints and the OnGetPoint there is no loop necessary, the chart internally takes care of this. You only need to pass the number of points, and return the value:
procedure TForm1.TMSFMXChart1GetNumberOfPoints(Sender: TObject; ASerie: TTMSFMXChartSerie; var ANumberOfPoints: Integer);
 begin
  ANumberOfPoints := Length(ARRAY);
end;

procedure TForm1.TMSFMXChart1GetPoint(Sender: TObject; ASerie: TTMSFMXChartSerie; AIndex: Integer;
  var APoint: TTMSFMXChartPointVirtual);
 begin
  APoint.YValue := ARRAY[AIndex];
end;
TMS FMX UI PackTTMSFMXGrid: How to show/popup a comment by clicking on a cell
To show a Popup with the cell comments you can use following code:
procedure TForm1.FormCreate(Sender: TObject);
begin
  TMSFMXGrid1.Comments[3, 3] := ''Hello''#13#10''World'';
end;

procedure TForm1.TMSFMXGrid1CellClick(Sender: TObject; ACol, ARow: Integer);
var
  obj: TControl;
begin
  obj := TMSFMXGrid1.GetCellObject(Cell(ACol, ARow));
  if Assigned(obj) and (obj is TTMSFMXCommentGridCell) then
    (obj as TTMSFMXCommentGridCell).ShowPopup;
end;
procedure TForm1.TMSFMXGrid1GetCellProperties(Sender: TObject; ACol,
  ARow: Integer; Cell: TFmxObject);
begin
  if Cell is TTMSFMXCommentGridCell then
  begin
    (Cell as TTMSFMXCommentGridCell).CommentPanel.CalloutPosition := TCalloutPosition.Top;
    (Cell as TTMSFMXCommentGridCell).Popup.Placement := TPlacement.BottomCenter;
    (Cell as TTMSFMXCommentGridCell).CommentText.Margins.Top := (Cell as TTMSFMXCommentGridCell).CommentPanel.CalloutLength + 2;
  end;
end;
 TMS FMX UI Pack
TTMSFMXGrid: A technique to check checkboxes in the grid for specific rows by using a filter
In the TMSFMXGrid, data is loaded via a CSV file and an extra column of checkboxes is added. Now, we want to check checkboxes for specific rows and instead of looping through all rows to find the matching rows and check the checkbox, we use the built-in grid filtering capability and check only the rows that remain after filtering and then remove the filter:
var
  i: integer;
begin
  TMSFMXGrid1.LoadFromCSV(''.\cars.csv'');
  TMSFMXGrid1.ColumnCount := TMSFMXGrid1.ColumnCount + 1;
  TMSFMXGrid1.AddCheckBoxColumn(TMSFMXGrid1.ColumnCount - 1);

  TMSFMXGrid1.Filter.Clear;
  TMSFMXGrid1.Filter.Add;
  TMSFMXGrid1.Filter.Items[0].Condition := ''BMW'';
  TMSFMXGrid1.Filter.Items[0].Column := 1;

  TMSFMXGrid1.ApplyFilter;

  for i := TMSFMXGrid1.FixedRows to TMSFMXGrid1.RowCount - 1 do
  begin
    TMSFMXGrid1.CheckBoxState[TMSFMXGrid1.ColumnCount - 1, TMSFMXGrid1.DisplToRealRow(i)] := true;
  end;

  TMSFMXGrid1.RemoveFilter;
end;