Blog
All Blog Posts | Next Post | Previous Post

 Extend TMS WEB Core with JS Libraries with Andrew:
Charting Part 6: Tag Clouds
Wednesday, September 21, 2022

In our final post in this miniseries on adding charting to our TMS WEB Core projects using JavaScript libraries, we'll look at how to add tag clouds (aka word
clouds). But while a traditional bar chart or pie chart might look largely the same
regardless of the charting library, and deliberately so, tag clouds can vary quite a bit in terms of their
presentation and styling, as well as their level of interactivity. As a result, we'll have a look at some
different options from both Chart.js and D3 Charts, and explore some of the ways these can be used for maximum
effectiveness.
Tag Cloud Example.
Motivation.
Tag clouds can be a quick and fun way to give your users an idea about the nature of the content that is available to them. If the tag cloud is interactive, it may even be possible to use it as an index of sorts, making it easy for the user to find content relevant to their interests. Depending on the amount and the nature of your content, it may be possible to create a tag cloud large enough to give a good representation of its contents. Or small enough to fit into a sidebar without overwhelming the user, particularly if there are additional indexes available. Regardless of the approach, they can be a visually appealing way to look at your data.
It is also important to point out that there are some who feel tag clouds are an abomination - an unfortunate entry in the prestigious field of data visualization. And they've got some valid points to back this up. If you want to read a rather opinionated take, check out Word Clouds Considered Harmful by Jacob Harris, a New York Times senior software architect.However,
like the Bar Chart Races we covered in the last post, tag clouds are generally applicable in a few narrowly defined
instances, and shouldn't really be used unless there's a specific experience you're trying to deliver. You
wouldn't replace the table of contents of an online book, or even its index, with a tag cloud, for example. However, you might add a tag cloud in addition to those other elements. But just be aware that there are often
better alternatives to displaying this kind of data. Using them is as much a stylistic choice as anything else.
Words vs. Tags.
Tag clouds can be built from various sources of data, but perhaps the two most popular are "words" and "tags". Let's use these TMS SOftware Blog posts as an example. Each blog post is obviously made up of a collection of words. One way to create a tag cloud is to combine all the words into a single list, and then sort by frequency. The most popular words, perhaps, would then be most representative of the content of the blog posts.
Or so the theory goes. Naturally, commonly used words like articles or adjectives might rise to the top more quickly than the main topics of the posts. Also, multi-word phrases (like "TMS WEB Core") might get split up and appear at different spots in such a list. Some work needs to be done to filter such a list, to both eliminate words we don't want and to perhaps promote words or phrases that might be more relevant than a frequency ranking would allow for. Taking all 35 TMS Software Blog posts that I've written so far, and sorting them in this fashion, here are the top 20 words. Not especially useful at first glance.
the: 6450
to: 4185
a: 3396
of: 2829
and: 2572
is: 2183
in: 1977
that: 1948
it: 1628
this: 1403
be: 1364
for: 1308
as: 1143
with: 1102
we: 979
can: 952
tms: 914
are: 892
but: 865
delphi: 800
An alternative approach is to use tags as the data source. For example, for each TMS Blog post I've written, I've added an entry to my profile on the Buy me a Coffee website. There, I can also associate any number of tags with each post, highlighting the JavaScript library used, for example, or some other aspect of the content. Typically, I add 2-5 tags depending on the post.
The end result is a more focused list of tags and their frequency. The downside is that I have to assign these tags manually to each post. If I think of a new tag, I'll have to review each post and see if it applies. No new "discovery" can arise in this variation, as only the pre-defined tags are used. For example, JavaScript might be a really good word that appears frequently that I didn't add as a tag, but because I didn't add it as a tag it won't automatically appear in the list. It also requires that tags are applied consistently. Here's what does appear, based on the tags that I've added.
Software Development: 38
TMS WEB Core: 38
Delphi: 37
Bootstrap: 10
Tabulator: 9
FlatPickr: 8
JSON: 7
FontAwesome: 6
XData: 5
macOS: 4
GitHub: 4
Luxon: 4
Linux: 4
Leaflet: 3
The Movie Database: 3
jQuery: 2
InteractJS: 2
D3: 2
Miletus: 2
WikiData: 2
Swiperjs: 1
VSC: 1
Bootstrap Carousel: 1
panzoom: 1
FileRobot Image Editor: 1
Electron: 1
DrawIO: 1
Sparklines: 1
Lazarus: 1
ChartJS: 1
Glidejs: 1
Slick Carousel: 1
Actorious: 1
Compression: 1
Brotli: 1
SPARQL: 1
PWA: 1
Markdown: 1
SunEditor: 1
Summernote: 1
CodeMirror: 1
Showdown: 1
BigTextJS: 1
Raspberry Pi: 1
While this list might be a bit more representative of the content of the blog posts, many of the tags are
referenced only once, which makes it hard to discern whether any are more interesting or important than any
others. And some, like "Software Development" could probably be excluded as it is somewhat redundant.
Regardless of whether we're using word frequencies or tags, it will be helpful to have a filter mechanism to help produce working lists that better reflect the content.
Content Management.
To start off our example application, let's set up a few lists that we can then use to produce better source data for generating our tag cloud. First, we'll set up a list of content that we can manage to make this work better for different blocks of text. As this is a post about JavaScript libraries, let's use a few JavaScript libraries as we go along.
We'll use Tabulator to handle the lists. We'll use CodeMirror 5 to allow easier editing of the content. We'll set up our usual CDN links for these in the Project.html, and a TWebHTMLDiv to hold them, as we've been doing all along. To round things out, we'll also use a few Font Awesome icons, the Cairo Google Font, and the current version of Bootstrap. And a custom CSS file to hold all of our CSS overrides.
    <!-- Bootstrap 5.2.1-->
    <script src="https://cdn.jsdelivr.net/npm/bootstrap@5.2.1/dist/js/bootstrap.bundle.min.js" integrity="sha384-u1OknCvxWvY5kfmNBILK2hRnQC3Pr17a+RTT6rIHI7NnikvbZlHgTPOOmMi466C8" crossorigin="anonymous"></script>
    <link href="https://cdn.jsdelivr.net/npm/bootstrap@5.2.1/dist/css/bootstrap.min.css" rel="stylesheet" integrity="sha384-iYQeCzEYFbKjA/T2uDLTpkwGzCiq6soy8tYaI1GyVh/UjpbCx/TYkiZhlZB6+fzT" crossorigin="anonymous">

    <!-- FontAwesome v6 Free -->
    <link rel="stylesheet" href="https://cdn.jsdelivr.net/npm/@fortawesome/fontawesome-free@6/css/all.min.css">

    <!-- Google Fonts: Cairo -->
    <link rel="preconnect" href="https://fonts.googleapis.com">
    <link rel="preconnect" href="https://fonts.gstatic.com" crossorigin>
    <link href="https://fonts.googleapis.com/css2?family=Cairo&display=swap" rel="stylesheet">

    <!-- Tabulator -->
    <script src="https://cdn.jsdelivr.net/npm/tabulator-tables@5/dist/js/tabulator.min.js"></script>
    <link rel="stylesheet" href="https://cdn.jsdelivr.net/npm/tabulator-tables@5/dist/css/tabulator.min.css">

    <!-- CodeMirror 5 -->
    <script src="https://cdn.jsdelivr.net/npm/codemirror@5/lib/codemirror.js"></script>
    <link rel="stylesheet" href="https://cdn.jsdelivr.net/npm/codemirror@5/lib/codemirror.min.css">

    <!-- Our own custom stylesheet -->
    <link rel="stylesheet" href="style.css">
For the first section of our example application, what we're after is the ability to have a mini database of "content" items - the blocks of text or lists of tags that we want to convert into tag clouds. This mini database can then be saved to the browser's "local storage" area.
When the app first starts, it will try to automatically load this
database. As this local storage survives browser restarts, this works well as a place to store this kind of
content and makes it largely transparent for the user. This could potentially be stored elsewhere, such as an
XData server, or explicitly in the user's filesystem somewhere else, if there was a need to have this information
available or editable from more than one location, or over an extended period of time.
The majority of the code for this section of the example app has been covered previously in the Tabulator and CodeMirror posts. There are a few new items to touch upon, though. The "Load Content" function uses the TWebOpenDialog component to bring up a file dialog that can be used to select multiple files. These are then appended to whatever is in the current editor.
The "Load URL" function uses a TWebHTTPRequest component to do something similar for a web page. The entire contents are imported as HTML in that case. We'll have a look at some filters in a moment that can be used to strip out the tags from the HTML that is imported, but whatever is between the tags is likely to remain and would need to be filtered as well, at least in some cases.
The "Save Content" button on the bottom right will save both changes to the editor and any changes made to the table contents, all to local storage.
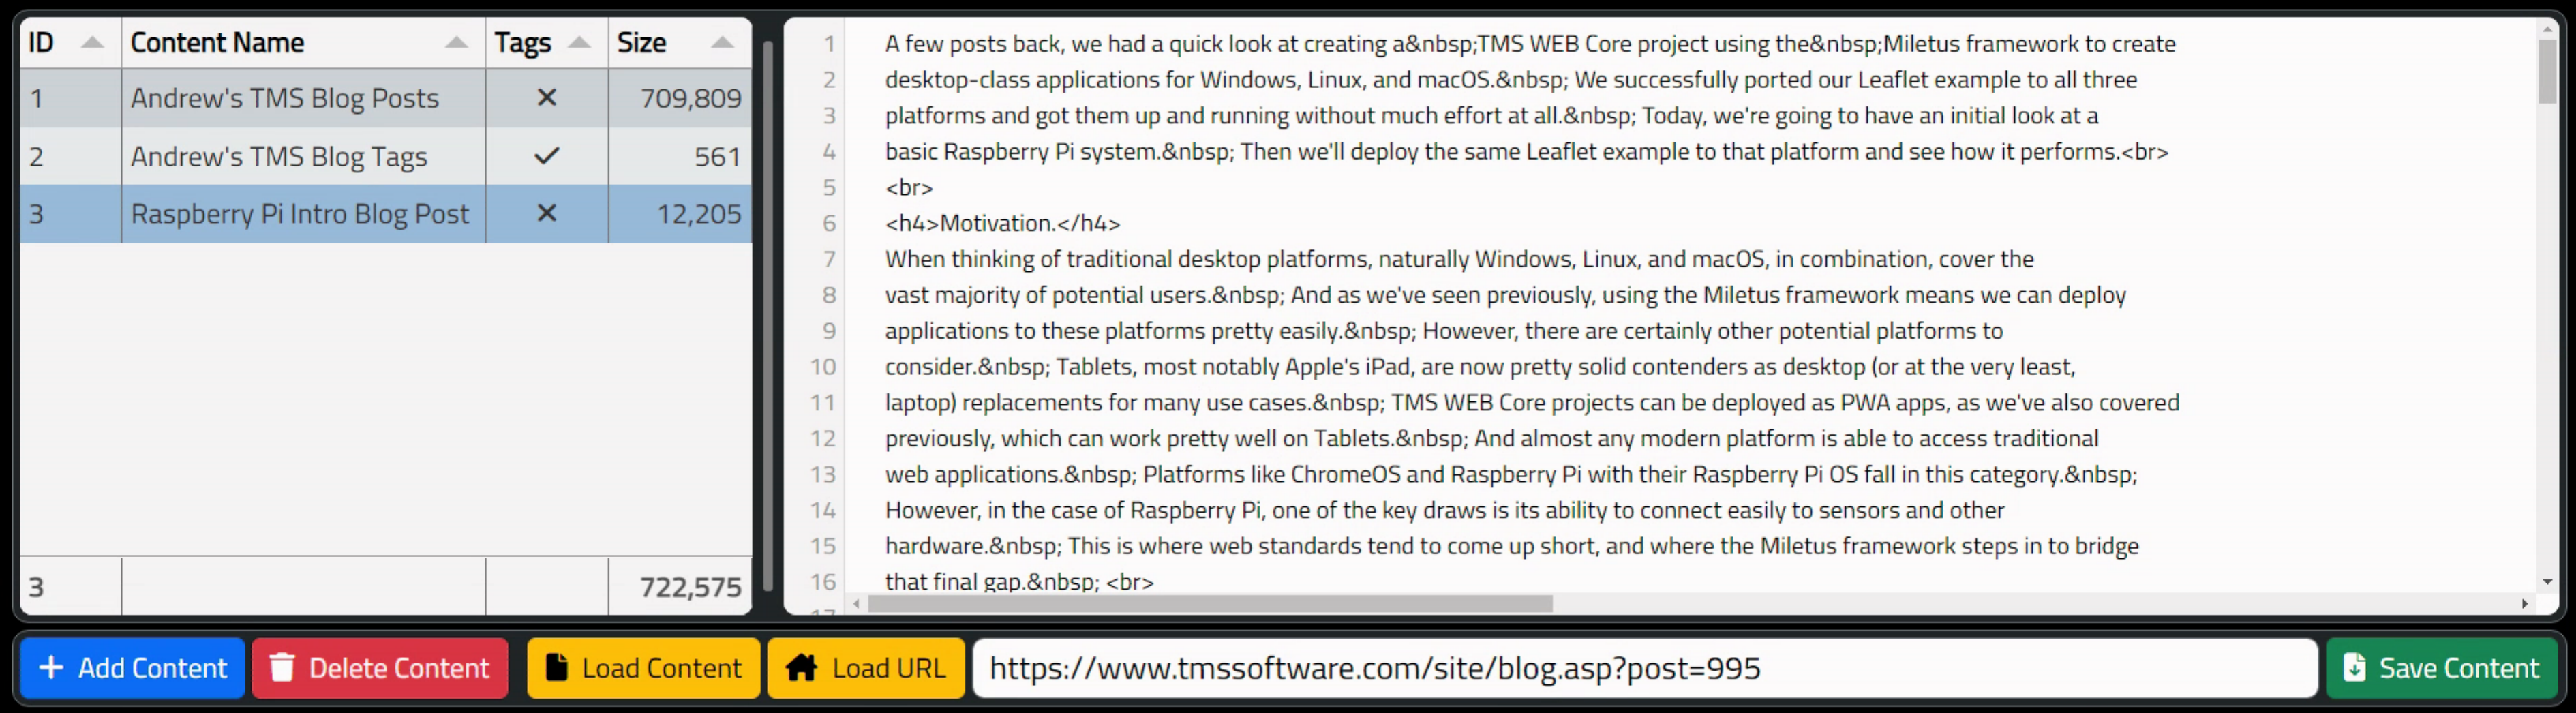
The end result is a reasonably polished interface that allows for editing of content, assigning names, and indicating whether the content is to be processed as words (where the frequency is derived) or as tags, where the last element of each line is expected to be a count of the occurrences of the first part of the line.
In the screenshot below, you can see three entries. First is the raw text for all 35 blog posts. Second is the selected content, showing the tags as listed above. The third entry is an HTML page imported directly, where the block of HTML before and after the main blog post itself has been removed (manually).
Clicking on the value in the Tags column will toggle between the "tick" and the "cross" values. Clicking "Save Content" will save the entire content section to local storage, which is automatically loaded when the application starts. If any edits are made to the actual content, the "Save Content" button needs to be clicked to save those changes. Also, when adding content using one of the Load functions, whatever is loaded is appended to the contents of the editor pane. So be sure to select the appropriate content item on the left, and clear the content if you intend to start fresh.
Managing Content.
Include, Exclude, and URLs.
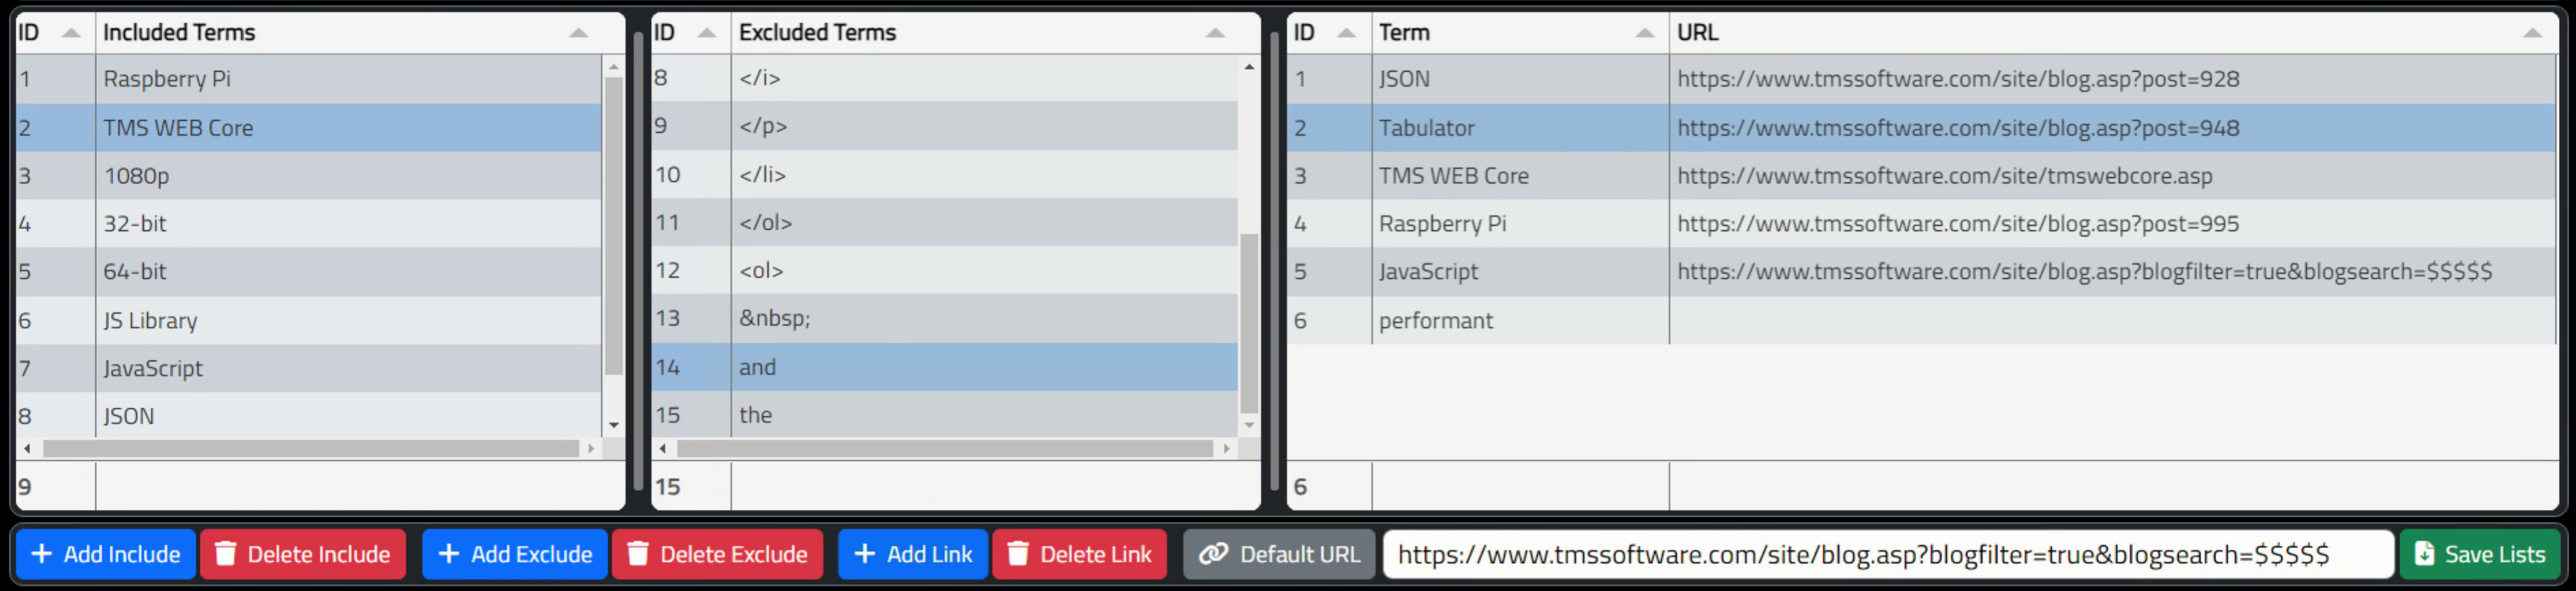
The next section of the example app deals with words or phrases that we explicitly want to include or exclude from the final list that is used to generate the tag cloud. The idea here is that we want to be able to reuse these lists for multiple content items, and this likely means that these lists will grow over time as more content is pushed through.
For Include, we'll be taking the supplied content and then counting instances of the Include entries, adding them to the final list, if they are found. And also removing them from subsequent processing so that they don't get duplicated. This is how we can deal with phrases like "TMS WEB Core" in the frequency counting method - we'll count the instances and then remove those phrases before continuing on with processing.
For Exclude, all we'll be doing is simply removing any instances of those phrases from the text that is being processed.
In both the Include and Exclude cases, the instances are replaced with a "space" character so as to not inadvertently create any new words by having adjacent text merged together.
The third list is for assigning a specific URL to a particular word or phrase. Many tag clouds are just decorative - they don't link anywhere. But if you want them to link to content, then there are a few considerations. Much of the time, it is sufficient to have the link point to a "search" URL, where the word or tag is passed to a web page that then performs the search using that term. This is likely to be the default for most of the words or tags.
In some cases, it is more desirable to direct the user to a specific page. For example, we might want the "Tabulator" link to point to the very first entry in the Tabulator miniseries. Or perhaps there are words that we want to include, but would rather not offer a link at all if it isn't likely to lead the user to anything interesting. For example, the word "performant" might show up, but without any additional context, it might not make sense to do a search for that term on its own.
The code for this is included in the example project, so we'll skip over it here, but it follows much the same kind of approach as the code we've already seen. Here's what the interface for the second section looks like.
Managing Lists.
Options and Generation.
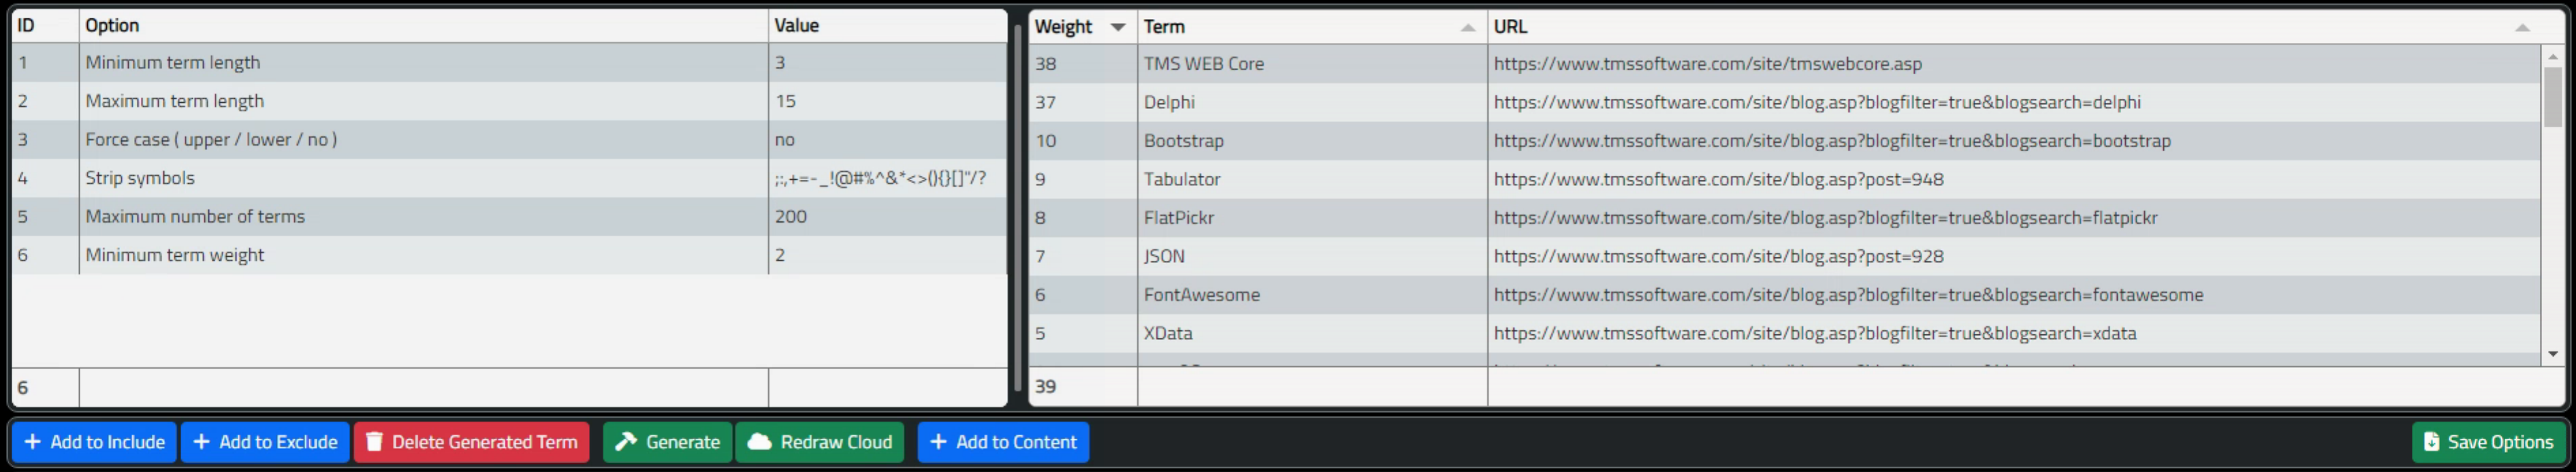
As far as options, there are just a handful to make the final processed list a little bit cleaner and to help shorten up the Include and Exclude lists by eliminating various flavors of junk. Like symbols, or words that have too few letters or too many letters, that sort of thing. There's also an option to change the case of the words. This is more useful if you want to take the resulting word lists and use them elsewhere, like in a crossword puzzle application for example. There are many other situations where these kinds of word lists can be useful.
The Generate function is used to actually create the list using all the available information. If the content is marked as "Tags" then this is an almost instant process where the list of tags is simply loaded up with a bit of light filtering as per the options. If it is a word list, this may take longer depending on how much content has to be processed.
There isn't an immediately obvious limit to how long the text can be, though longer passages can take quite a bit of time. Once done, however, there is an option to save the list as a new content item - essentially converting a passage into a tag list. Then subsequent fiddling with the options for the tag cloud doesn't have to involve reprocessing the passage again.
URLs are added at the same time, using either the Default URL provided or one specified explicitly. In either case, the $$$$$ placeholder is used to swap in the term if needed in the URL, with a little extra step of replacing spaces in the term with %20 to help make it a valid URL. This works fine for regular text and URLs, but more work would likely be needed to address more complex text encodings.
Here's what this section looks like.
Options and Generation.
Alright. With all that out of the way, all we're left with then is drawing the tag cloud itself. We already have all the data, so this can proceed relatively easily. here are two variations that have been added to the example project. The Chart.js variation and the D3 variation, each with their own considerations.
Chart.js Tag Clouds.
To enable Tag Clouds with Chart.js, we'll naturally have to add Chart.js to our project and then a separate plugin.
    <!-- ChartJS and Word Cloud Plugin -->
    <script src="https://cdn.jsdelivr.net/npm/chart.js@3.9.1/dist/chart.min.js"></script>
    <script src="https://cdn.jsdelivr.net/npm/chartjs-chart-wordcloud@3.9.1/build/index.umd.min.js"></script>
There are examples in the GitHub repository that show how to use the Word Cloud chart. We're not doing anything too fancy. We pass in the processed list of words and their frequency, as well as the URL we want to use for the link. Some parameters are added which are tied to the list of Options, making it easy to adjust and experiment with. For example, the relative sizes of the words as compared to their weights can be adjusted using the two Factor options. Similarly, the colors can be adjusted if you're after a particular look. The size of the cloud can also be adjusted via the options. Here's what we're working with.
procedure TForm1.DrawChartJSCloud;
var
  chartwidth: Integer;
  chartheight: Integer;
begin

  asm
    chartwidth = parseInt(this.tabOptionList.getRowFromPosition(7).getCell("VALUE").getValue());
    chartheight = parseInt(this.tabOptionList.getRowFromPosition(8).getCell("VALUE").getValue());
  end;
  divChartHolder.Height := chartheight;
  divChartHolder.HTML.Text := '<canvas id="Chart" width: '+IntToStr(chartwidth)+'px; height: '+IntToStr(chartheight)+'px;"></canvas>';

  asm
    var words = this.tabList.getData();

    // Enforce minimum term weights
    var maxwords = parseInt(this.tabOptionList.getRowFromPosition(5).getCell("VALUE").getValue());
    var minweight = parseInt(this.tabOptionList.getRowFromPosition(6).getCell("VALUE").getValue());
    var factor1 = parseInt(this.tabOptionList.getRowFromPosition(10).getCell("VALUE").getValue());
    var factor2 = parseInt(this.tabOptionList.getRowFromPosition(11).getCell("VALUE").getValue());
    var textcolor1 = this.tabOptionList.getRowFromPosition(12).getCell("VALUE").getValue();
    var textcolor2 = this.tabOptionList.getRowFromPosition(13).getCell("VALUE").getValue();
    var textcolor3 = this.tabOptionList.getRowFromPosition(14).getCell("VALUE").getValue();

    for (var i = words.length - 1; i >= 0; i--) {
      if (i >= maxwords) {
        words.splice(i,1);
      }
      else if (words[i].WEIGHT < minweight) {
        words.splice(i,1);
      }
    }

    const data = {
      labels: words.map((d) => d.TERM),
      datasets: [
        {
          label: '',
          data: words.map((d) => (factor1 + (d.WEIGHT * factor2))),
          color: words.map((d) => (d.TERM.length <= 5 ? textcolor1 : (d.TERM.length <= 10 ? textcolor2 : textcolor3)))
        },
      ],
    };

    const ctx = document.getElementById('Chart').getContext('2d');
    window.myBar = new Chart(ctx, {
      type: 'wordCloud',
      data: data,
      options: {
        title: {
          display: false,
          text: 'Chart.js Word Cloud',
        },
        onClick(e) {
          const activePoints = myBar.getElementsAtEventForMode(e, 'nearest', {
            intersect: true
          }, false)
          const [{
            index
          }] = activePoints;
          if (words[index].URL !== '') {
            window.open(words[index].URL, '_blank');
          }
        },
        plugins: {
          legend: {
            display: false,
          },
          tooltip: {
           enabled: false
          }
        },
      }
    });

  end;

end;
For the example below, the most recent TMS Blog Post about using TMS WEB Core with Raspberry Pi was used. The
terms were filtered (a lot) but could probably use a little more tuning. After a bit of fiddling with the parameters,
and clicking the Redraw Cloud a few times to try out different layouts, we end up with something like the
following. Clicking on any of the words will launch a separate browser tab. Just three colors are used in this
example, based on the length of the word, but this can be further customized to be based on the weight or some
other criteria.
ChartJS Tag Cloud.
This is a <canvas> element, so it can be saved as a PNG. Which isn't all that useful as it will then lose its interaction capabilities.
D3 Tag Clouds.
As with ChartJS, we're going to use a separate plugin to draw tag clouds in D3, though this isn't strictly required. And, as with ChartJS, we'll need to add a couple of links to our Project.html file to get this up and running. We've also got an extra library here to save the resulting image. D3 generates SVG files. And browsers typically don't let you just export them directly.
    <!-- D3 and Cloud Plugin and SVG Export library-->
    <script src="https://cdn.jsdelivr.net/npm/d3@7/dist/d3.min.js"></script>
    <script src="https://cdn.jsdelivr.net/npm/d3-cloud@1.2.5/build/d3.layout.cloud.min.js"></script>
    <script src="https://sharonchoong.github.io/svg-exportJS/svg-export.min.js"></script>
The code for D3 is largely similar to ChartJS. They're doing the same things after all. The main technical
difference is that with D3, the image is being rendered as an SVG element rather than a <canvas> element. And SVG elements have some interesting properties. For example, <a> tags can be added to the SVG element
so that when the SVG file is exported, these go with it. This means that you can essentially copy/paste an SVG
file and the links are maintained all the way through. Which is pretty handy. While the <canvas> element
from ChartJS supports the same user experience on the page, once the image leaves that page, there's nothing to handle
the link mechanism.
Another benefit of the D3 variant is that it has more options for layout. Many more. And also the ability to more easily customize things like the URL links or the colors, just by using D3 normally. This makes it super easy to customize things further. For example, most of the basic D3 tag cloud examples don't have links. Adding them here was just a few lines of code. Not to say that implementing this in D3 is trivial, but once implemented, making changes can be. Here's what we're looking at as far as an implementation.
procedure TForm1.DrawD3Cloud;
var
  chartwidth: Integer;
  chartheight: Integer;
begin

  asm
    chartwidth = parseInt(this.tabOptionList.getRowFromPosition(7).getCell("VALUE").getValue());
    chartheight = parseInt(this.tabOptionList.getRowFromPosition(8).getCell("VALUE").getValue());
  end;
  divChartHolder.Height := chartheight;
  divChartHolder.HTML.Text := '<div id="Chart" width: '+IntToStr(chartwidth)+'px; height: '+IntToStr(chartheight)+'px;"></canvas>';
  divChartHolder.Visible := True;

  asm
    var terms = this.tabList.getData();

    // Enforce minimum term weights
    var maxwords = parseInt(this.tabOptionList.getRowFromPosition(5).getCell("VALUE").getValue());
    var minweight = parseInt(this.tabOptionList.getRowFromPosition(6).getCell("VALUE").getValue());
    var factor1 = parseFloat(this.tabOptionList.getRowFromPosition(10).getCell("VALUE").getValue());
    var factor2 = parseFloat(this.tabOptionList.getRowFromPosition(11).getCell("VALUE").getValue());
    var textcolor1 = this.tabOptionList.getRowFromPosition(12).getCell("VALUE").getValue();
    var textcolor2 = this.tabOptionList.getRowFromPosition(13).getCell("VALUE").getValue();
    var textcolor3 = this.tabOptionList.getRowFromPosition(14).getCell("VALUE").getValue();

    for (var i = terms.length - 1; i >= 0; i--) {
      if (i >= maxwords) {
        terms.splice(i,1);
      }
      else if (terms[i].WEIGHT < minweight) {
        terms.splice(i,1);
      }
    }

    var rotations = [-60, -30, 0, 30, 60];

    var layout = d3.layout.cloud()
    .size([chartwidth, chartheight])
    .words(terms)
    .padding(1)
    .rotate(function() { return rotations[Math.floor(Math.random()*rotations.length)]})
    .font("Cairo")
    .fontSize(function(d) { return (factor1 + (d.WEIGHT * factor2)); })
    .on("end", draw);

    layout.start();

    function draw(words) {
      d3.select("#Chart")
        .append("svg")
          .attr("id", "ChartSVG")
          .attr("width", layout.size()[0])
          .attr("height", layout.size()[1])
        .append("g")
          .attr("transform", "translate(" + layout.size()[0] / 2 + "," + layout.size()[1] / 2 + ")")
        .selectAll("text")
        .data(words)
        .enter().append("text")
          .style("font-size", function(d) { return d.size + "px"; })
          .style("font-family", "Impact")
          .style("fill", function(d) { return ((d.TERM.length <= 5) ? textcolor1 : ((d.TERM.length <= 10) ? textcolor2 : textcolor3)) } )
          .attr("text-anchor", "middle")
          .attr("transform", function(d) {
          return "translate(" + [d.x, d.y] + ")rotate(" + d.rotate + ")";
        })
        .append("a")
          .attr("href",function(d) {return d.URL;})
          .attr("target", "_blank")
          .style("text-decoration", "none")
          .text(function(d) { return d.TERM; })
    }
  end;
end;
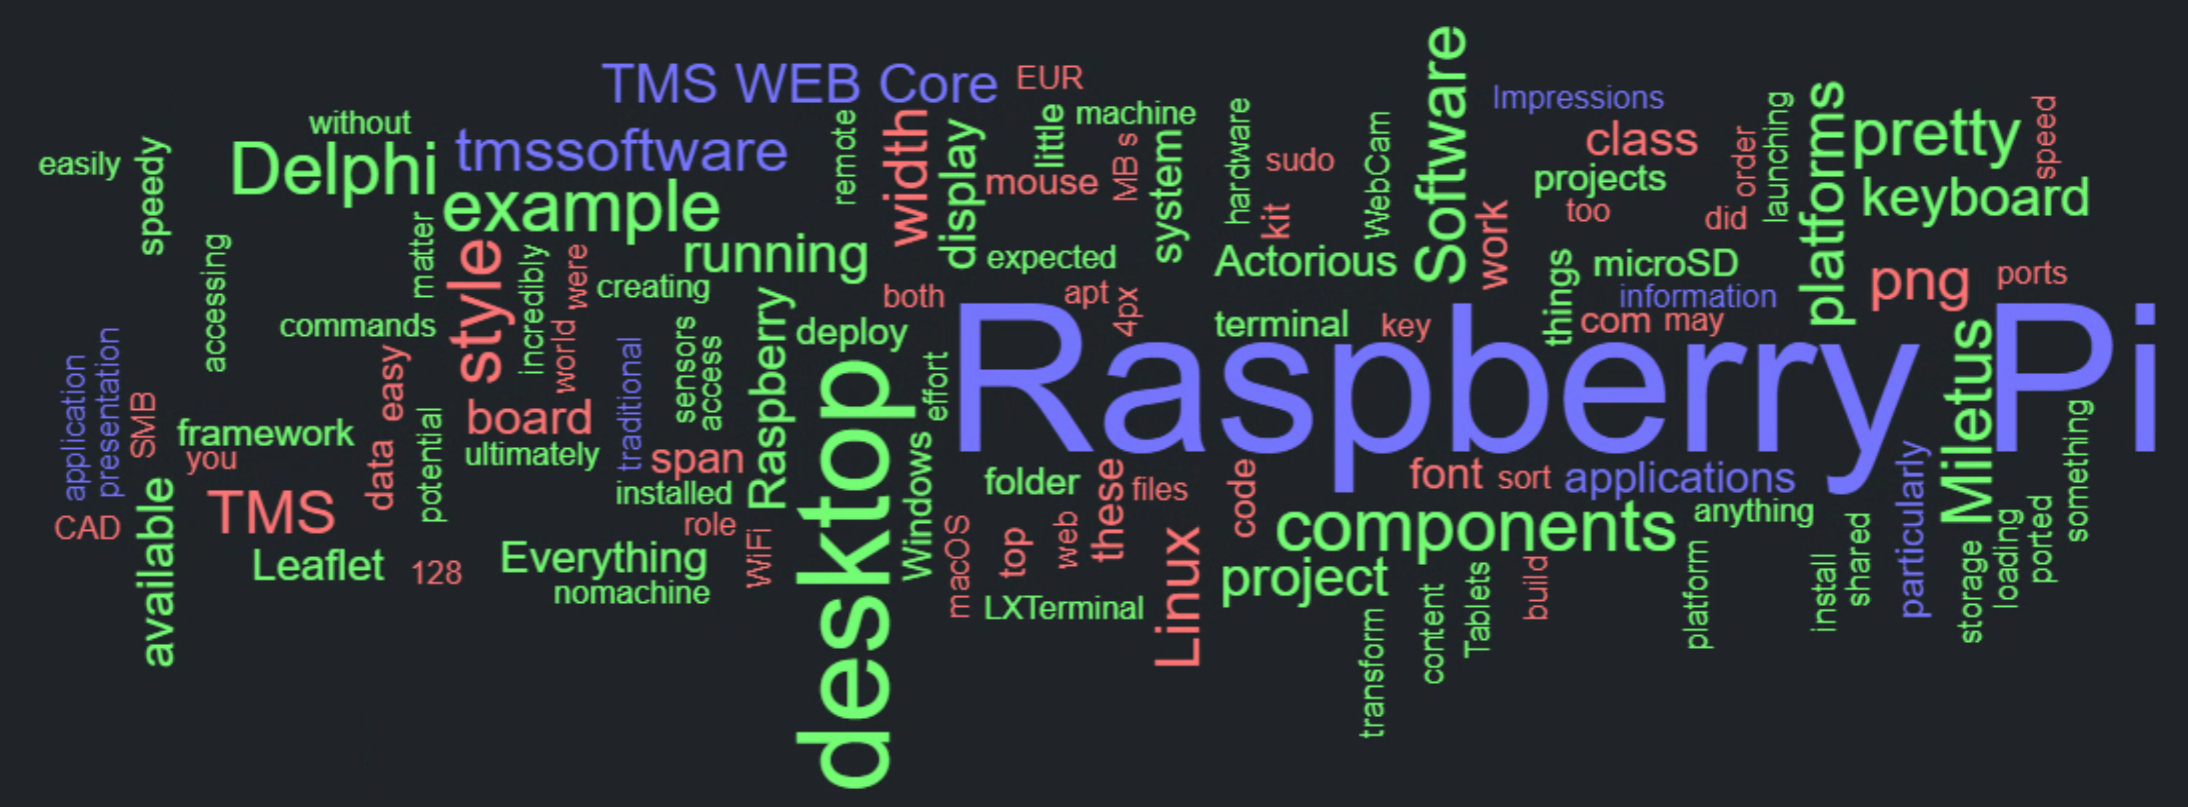
Using the same data and tweaking a few parameters, like including more terms, we can get the following tag cloud
without much effort. This is the same tool used to create the tag cloud at the top of this document. Just that
in that case, all of the content from all of my blog posts was used as the source data.
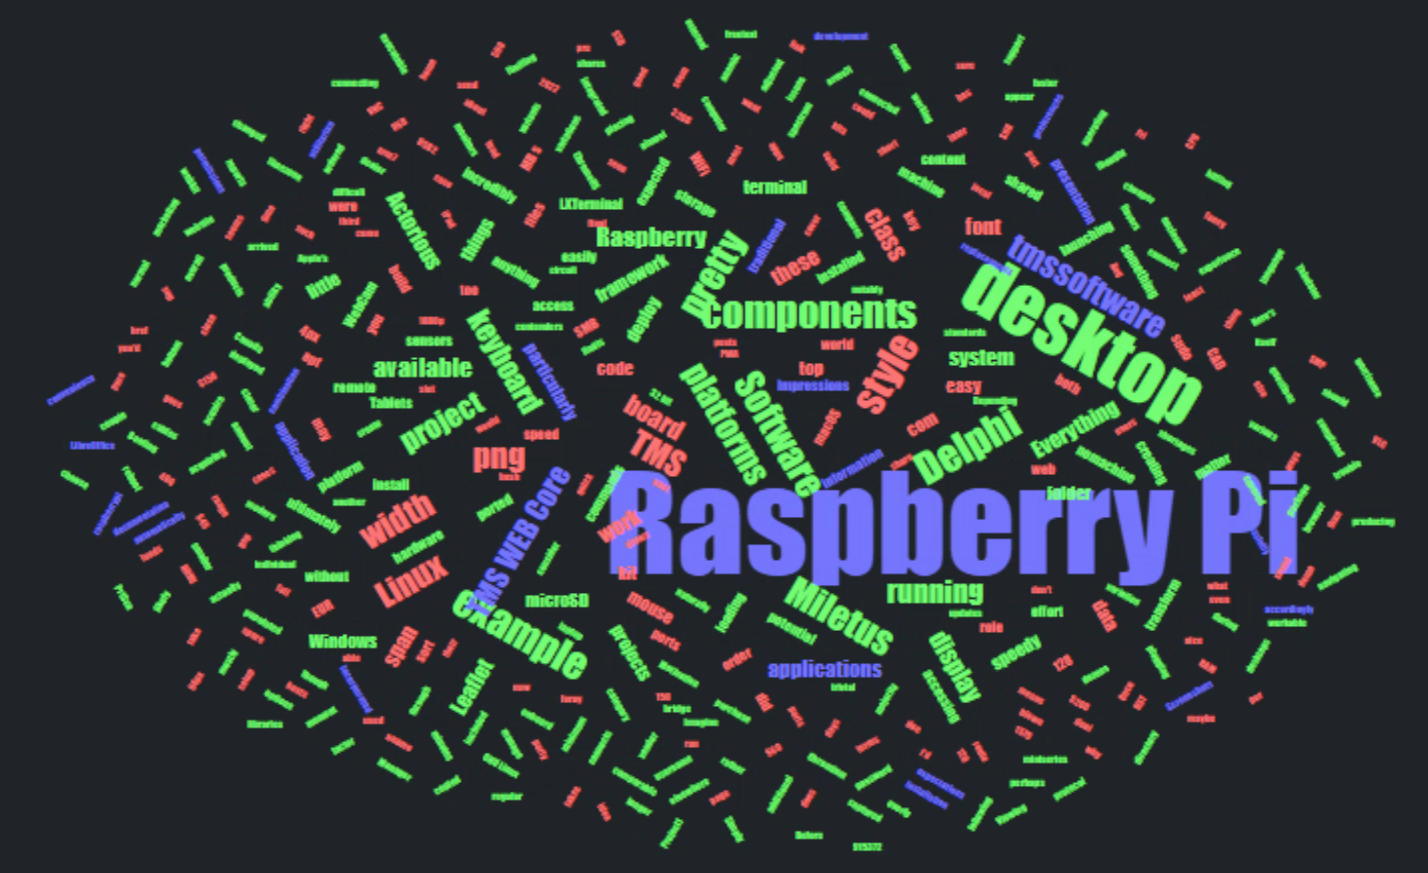
D3 Tag Cloud.
In order to download this SVG file, an extra helper JavaScript library is used. Also, note that the SVG is created with just the tags themselves, no background or borders. So if you look at this exported SVG file in a browser, it will have a white background.
procedure TForm1.btnDownloadSVGClick(Sender: TObject);
begin
  // Download D3-generated SVG File
  asm
    svgExport.downloadSvg(
      document.getElementById("ChartSVG"),
      "TagCloud"
    );
  end;
end;
The Full Application.
To put everything together then, here's a screenshot showing the birds-eye-view of the entire application, using the Buy me a Coffee tags as the source data.
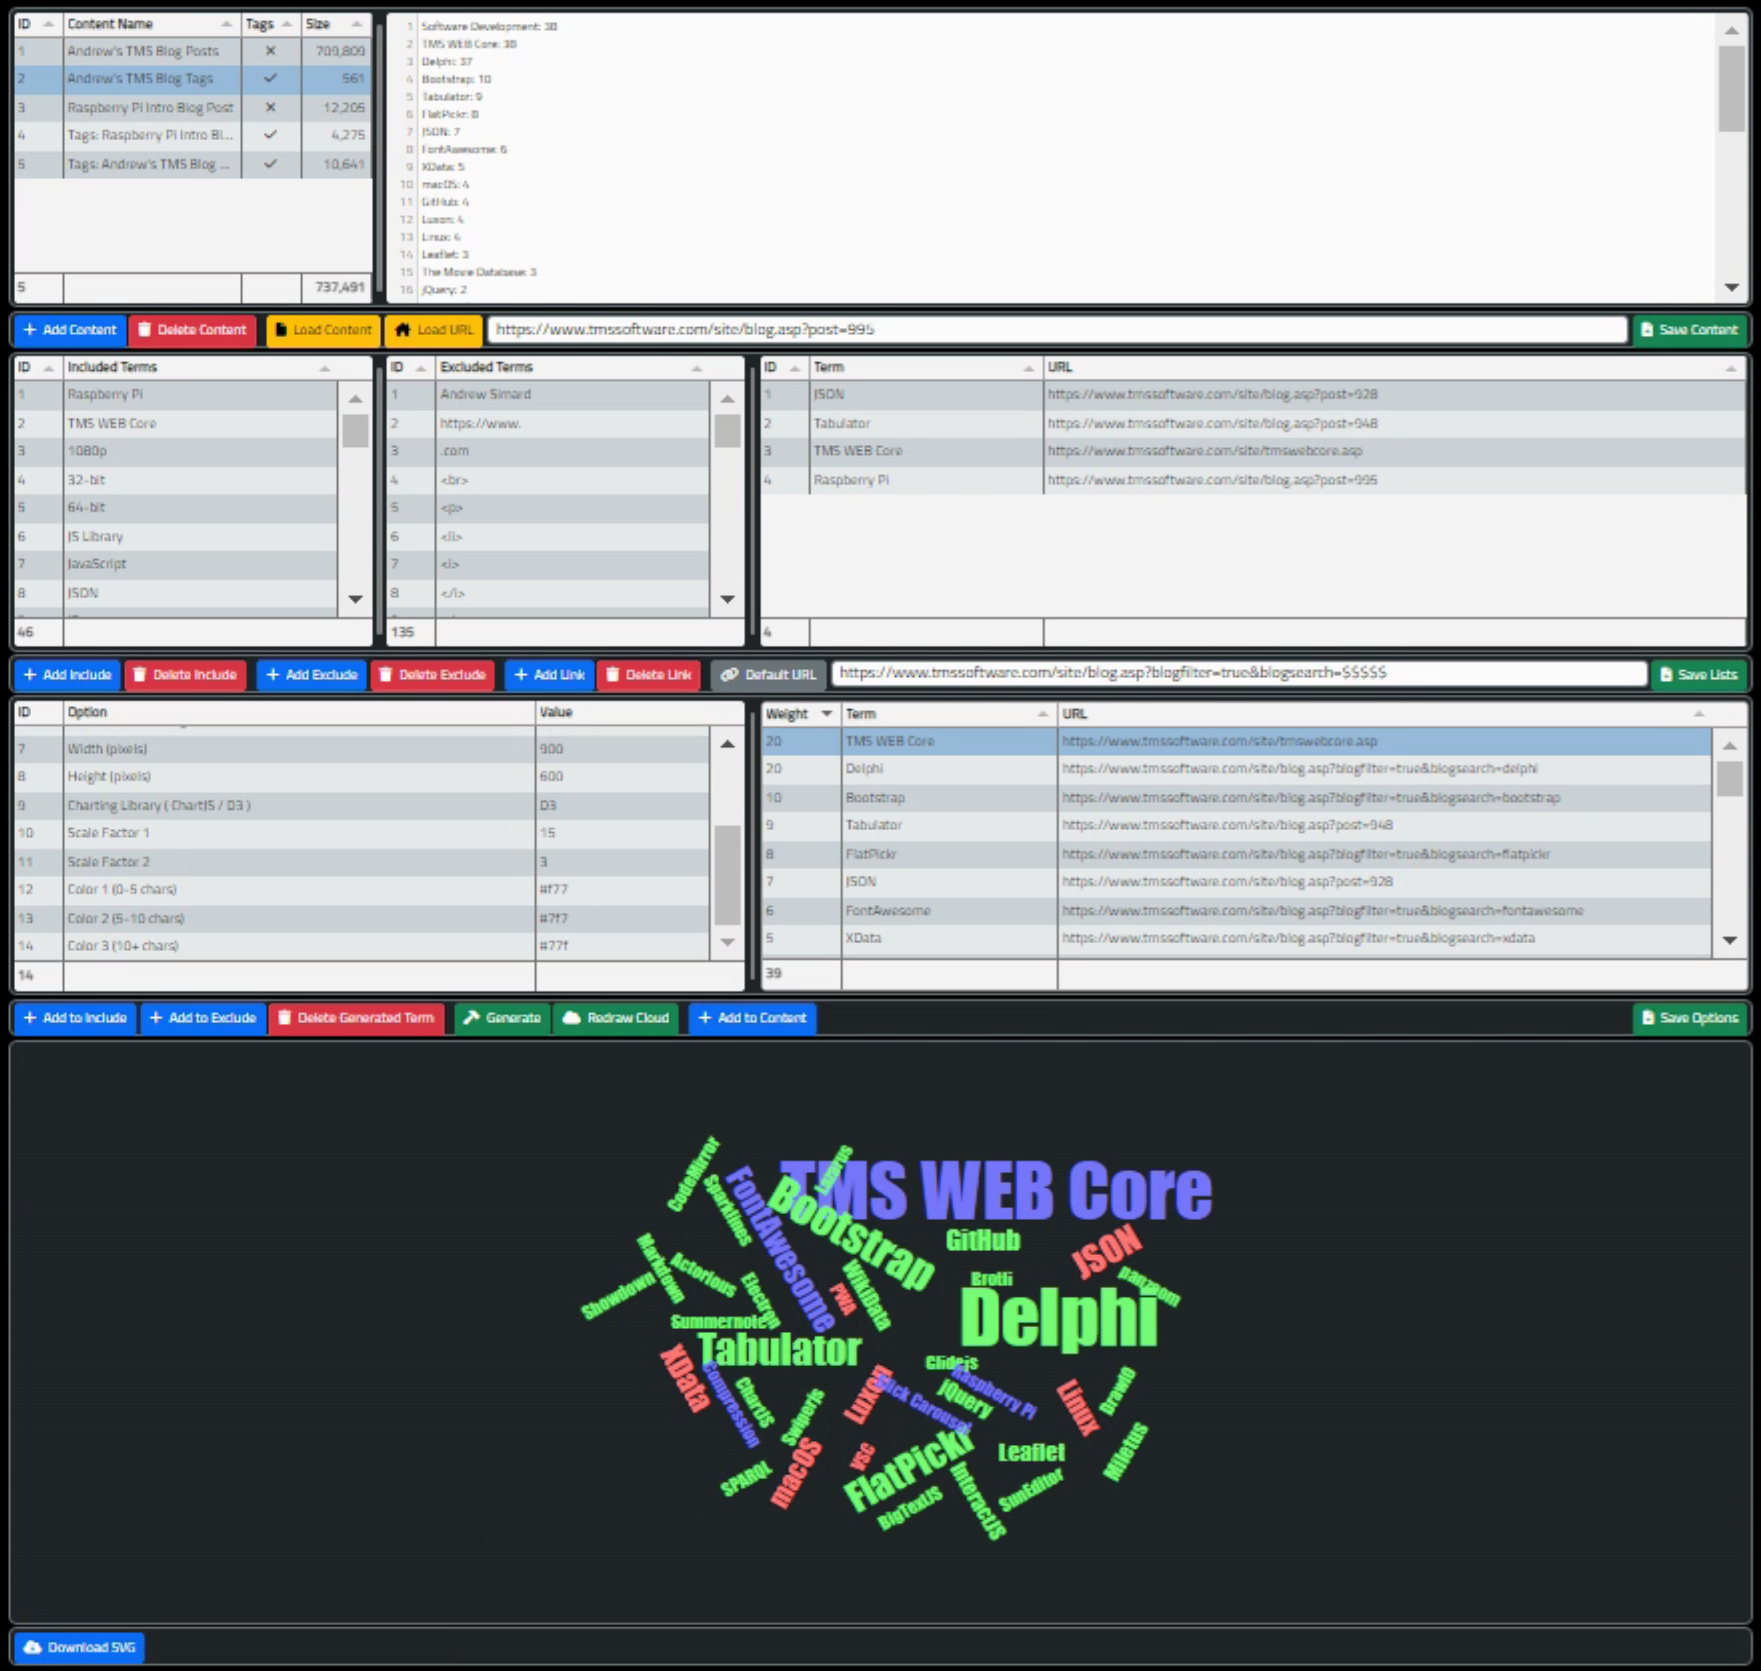
Birds-Eye-View
And with that, we've now finished up our miniseries on using charting JavaScript libraries within TMS WEB Core projects.
Follow Andrew on 𝕏 at @WebCoreAndMore or join our 𝕏 Web Core and More Community.
Related Posts
Charting Part 1: Sparklines
Charting Part 2: Chart.js
Charting Part 3: D3.js Introduction
Charting Part 4: D3.js Interaction
Charting Part 5: D3.js Animation
Charting Part 6: Tag Clouds
Andrew Simard

This blog post has not received any comments yet.
All Blog Posts | Next Post | Previous Post