Blog
All Blog Posts | Next Post | Previous Post

 Extend TMS WEB Core with JS Libraries with Andrew:
Charting Part 5: D3.js Animation
Tuesday, September 13, 2022

Last time out, we had a look at interacting with D3 charts, specifically panning, zooming, and using tooltips to show additional information. But these are the kinds of things you can find in many JS charting libraries. This time out, we're going to have a look at animation in D3, to breathe a little more life into your TMS WEB Core charting activities. We're looking specifically at the popular "bar chart race" animation, typically used to show trends over time. You've probably seen them before in charts such as the richest billionaires, the most popular programming languages, or even this bar chart race about bar chart race channels.
Motivation.
While there are some (perhaps many) that believe that visualizing data using something like a bar chart race is less than professional, it should serve at the very least as an illustration of how it is possible to use nearly every aspect of D3 within a TMS WEB Core project. Much of the work that follows will rely heavily on JavaScript, as the examples used were originally written in JavaScript. But as we've seen in numerous other posts, much of the JavaScript can be replaced or augmented with Delphi code. Particularly the important bits, like getting the actual data from somewhere else, or providing additional integration with the rest of your project. So don't think that JavaScript is the only way to approach this. However, some JavaScript is needed because D3 is a Javascript library, after all.
This should also serve as a bit of an example of what is needed to convert a random D3 example from the web into something that works within a TMS WEB Core project. Sometimes this is easy, if the example is written in pure Vanilla JavaScript and doesn't rely on too many additional libraries. Sometimes it can be a bit more work. But, due to the ability to integrate JavaScript directly into a TMS WEB Core project using asm...end blocks, this is usually not all that difficult. Any changes are likely more to do with further customizing the example, rather than just trying to get it to work.
Bar Chart Race: Brands
For our first example, we're going to have a look at this Top
Global Brands example. There are numerous other examples using various approaches within D3, but this one
was chosen primarily because it is already in pure JavaScript and can mostly be copied & pasted into a TMS WEB Core
project. To implement this example as closely as possible to what they've presented, we can start
with a few quick steps.
- We'll need the D3 library added to our Project.html file as we have done previously.
- For the sake of simplicity, we can just copy their CSS directly into the Project.html file as well.
- We'll create a new TMS WEB Core Bootstrap project using the template that we've used previously.
- We'll add a button to launch the chart and add their JavaScript to the OnClick handler for that button.
Our Project.html file then looks like the following. Normally, CSS like this could also be added to a separate
CSS file for your project, making it a little nicer in that the CSS could be more easily modified for different
projects. But for now, this works just as well to get us up and running. The only modification was to remove
the opacity from one of the rules (text.yearText) to help with the styling a bit.
<!DOCTYPE html>
<html lang="en">
  <head>
    <meta http-equiv="Content-Type" content="text/html; charset=utf-8"/>
    <meta content="width=device-width, initial-scale=1" name="viewport"/>
    <noscript>Your browser does not support JavaScript!</noscript>
    <link href="data:;base64,=" rel="icon"/>
    <title>TMS Web Project</title>
    <script src="bootstrap.bundle.min.js" type="text/javascript"></script>
    <link crossorigin="anonymous" href="bootstrap.min.css" rel="stylesheet"/>
    <script src="$(ProjectName).js" type="text/javascript"></script>

    <script src="https://cdn.jsdelivr.net/npm/d3@7/dist/d3.min.js"></script>

    <style>
      text{
        font-size: 16px;
        font-family: Open Sans, sans-serif;
      }
      text.title{
        font-size: 24px;
        font-weight: 500;
      }
      text.subTitle{
        font-weight: 500;
        fill: #777777;
      }
      text.caption{
        font-weight: 400;
        font-size: 14px;
        fill: #777777;
      }
      text.label{
        font-weight: 600;
      }
      text.valueLabel{
       font-weight: 300;
      }
      text.yearText{
        font-size: 64px;
        font-weight: 700;
      }
      .tick text {
        fill: #777777;
      }
      .xAxis .tick:nth-child(2) text {
        text-anchor: start;
      }
      .tick line {
        shape-rendering: CrispEdges;
        stroke: #dddddd;
      }
      .tick line.origin{
        stroke: #aaaaaa;
      }
      path.domain{
        display: none;
      }
    </style>

  </head>
  <body>
  </body>
  <script type="text/javascript">rtl.run();</script>
</html>
On our form, we've got a TWebHTMLDiv set to 1000px by 500px with the usual styling - dark background and
rounded border. Beneath that, we've got a button. All we're doing here is adding a block of JS to the button
to do 100% of the work. Minor edits were made to adjust the colors to fit a darker theme. And a CSS filter
drop-shadow was used instead of the halo code that they used. Simpler. And more effective. But this is all
just cosmetic, of course. Here's the block of code.
procedure TForm1.btnLaunchClick(Sender: TObject);
begin

  asm
    divChartHolder.innerHTML = '';

    var svg = d3.select('#divChartHolder').append('svg')
      .attr('width', 1000)
      .attr('height', 500);

    var tickDuration = 500;
    var top_n = 12;
    var height = 500;
    var width = 1000;

    const margin = {
      top: 75,
      right: 10,
      bottom: 10,
      left: 10
    };

    let barPadding = (height-(margin.bottom+margin.top))/(top_n*5);

    let title = svg.append('text')
      .attr('class', 'title')
      .attr('x', 5)
      .attr('y', 24)
      .attr('fill','yellow')
      .html('18 years of Interbrand’s Top Global Brands');

    let subTitle = svg.append('text')
      .attr('class', 'subTitle')
      .attr('x', 5)
      .attr('y', 50)
      .html('Brand value, $m');

    let caption = svg.append('text')
      .attr('class', 'caption')
      .attr('x', width-90)
      .attr('y', height-15)
      .style('text-anchor', 'middle')
      .html('Source: Interbrand');

    let year = 2000;

    d3.csv('brand_values.csv').then(function(data) {

      data.forEach(d => {
        d.value = +d.value,
        d.lastValue = +d.lastValue,
        d.value = isNaN(d.value) ? 0 : d.value,
        d.year = +d.year,
        d.colour = d3.hsl(Math.random()*360,0.75,0.75)
      });

      let yearSlice = data.filter(d => d.year == year && !isNaN(d.value))
        .sort((a,b) => b.value - a.value)
        .slice(0, top_n);

      yearSlice.forEach((d,i) => d.rank = i);

      let x = d3.scaleLinear()
        .domain([0, d3.max(yearSlice, d => d.value)])
        .range([margin.left, width-margin.right-65]);

      let y = d3.scaleLinear()
        .domain([top_n, 0])
        .range([height-margin.bottom, margin.top]);

      let xAxis = d3.axisTop()
        .scale(x)
        .ticks(width > 500 ? 5:2)
        .tickSize(-(height-margin.top-margin.bottom))
        .tickFormat(d => d3.format(',')(d));

      svg.append('g')
        .attr('class', 'axis xAxis')
        .attr('transform', `translate(0, ${margin.top})`)
        .call(xAxis)
        .selectAll('.tick line')
        .classed('origin', d => d == 0);

      svg.selectAll('rect.bar')
        .data(yearSlice, d => d.name)
        .enter()
        .append('rect')
        .attr('class', 'bar')
        .attr('x', x(0)+1)
        .attr('width', d => x(d.value)-x(0)-1)
        .attr('y', d => y(d.rank)+5)
        .attr('height', y(1)-y(0)-barPadding)
        .style('fill', d => d.colour);

      svg.selectAll('text.label')
        .data(yearSlice, d => d.name)
        .enter()
        .append('text')
        .attr('class', 'label')
        .attr('x', d => x(d.value)-8)
        .attr('y', d => y(d.rank)+5+((y(1)-y(0))/2)+1)
        .style('text-anchor', 'end')
        .html(d => d.name);

      svg.selectAll('text.valueLabel')
        .data(yearSlice, d => d.name)
        .enter()
        .append('text')
        .attr('class', 'valueLabel')
        .attr('x', d => x(d.value)+5)
        .attr('y', d => y(d.rank)+5+((y(1)-y(0))/2)+1)
        .attr('fill','white')
        .text(d => d3.format(',.0f')(d.lastValue));

      let yearText = svg.append('text')
        .attr('class', 'yearText')
        .attr('x', width - 90)
        .attr('y', height-35)
        .style('text-anchor', 'middle')
        .html(~~year)
        .attr('fill','white')
        .style('filter','drop-shadow(0px 0px 5px yellow)');

      let ticker = d3.interval(e => {

        yearSlice = data.filter(d => d.year == year && !isNaN(d.value))
          .sort((a,b) => b.value - a.value)
          .slice(0,top_n);

        yearSlice.forEach((d,i) => d.rank = i);

        x.domain([0, d3.max(yearSlice, d => d.value)]);

        svg.select('.xAxis')
          .transition()
          .duration(tickDuration)
          .ease(d3.easeLinear)
          .call(xAxis);

        let bars = svg.selectAll('.bar').data(yearSlice, d => d.name);

        bars
          .enter()
          .append('rect')
          .attr('class', d => `bar ${d.name.replace(/\s/g,'_')}`)
          .attr('x', x(0)+1)
          .attr( 'width', d => x(d.value)-x(0)-1)
          .attr('y', d => y(top_n+1)+5)
          .attr('height', y(1)-y(0)-barPadding)
          .style('fill', d => d.colour)
          .transition()
            .duration(tickDuration)
            .ease(d3.easeLinear)
            .attr('y', d => y(d.rank)+5);

        bars
          .transition()
            .duration(tickDuration)
            .ease(d3.easeLinear)
            .attr('width', d => x(d.value)-x(0)-1)
            .attr('y', d => y(d.rank)+5);

        bars
          .exit()
          .transition()
            .duration(tickDuration)
            .ease(d3.easeLinear)
            .attr('width', d => x(d.value)-x(0)-1)
            .attr('y', d => y(top_n+1)+5)
            .remove();

        let labels = svg.selectAll('.label')
          .data(yearSlice, d => d.name);

        labels
          .enter()
          .append('text')
          .attr('class', 'label')
          .attr('x', d => x(d.value)-8)
          .attr('y', d => y(top_n+1)+5+((y(1)-y(0))/2))
          .style('text-anchor', 'end')
          .html(d => d.name)
          .transition()
            .duration(tickDuration)
            .ease(d3.easeLinear)
            .attr('y', d => y(d.rank)+5+((y(1)-y(0))/2)+1);

           labels
          .transition()
            .duration(tickDuration)
            .ease(d3.easeLinear)
            .attr('x', d => x(d.value)-8)
            .attr('y', d => y(d.rank)+5+((y(1)-y(0))/2)+1);

        labels
          .exit()
          .transition()
            .duration(tickDuration)
            .ease(d3.easeLinear)
            .attr('x', d => x(d.value)-8)
            .attr('y', d => y(top_n+1)+5)
            .remove();

        let valueLabels = svg.selectAll('.valueLabel').data(yearSlice, d => d.name);

        valueLabels
          .enter()
          .append('text')
            .attr('class', 'valueLabel')
            .attr('x', d => x(d.value)+5)
            .attr('y', d => y(top_n+1)+5)
            .attr('fill','white')
            .text(d => d3.format(',.0f')(d.lastValue))
            .transition()
              .duration(tickDuration)
              .ease(d3.easeLinear)
              .attr('y', d => y(d.rank)+5+((y(1)-y(0))/2)+1);

        valueLabels
          .transition()
            .duration(tickDuration)
            .ease(d3.easeLinear)
            .attr('x', d => x(d.value)+5)
            .attr('y', d => y(d.rank)+5+((y(1)-y(0))/2)+1)
            .tween("text", function(d) {
              let i = d3.interpolateRound(d.lastValue, d.value);
              return function(t) {
                this.textContent = d3.format(',')(i(t));
              };
            });

        valueLabels
          .exit()
          .transition()
            .duration(tickDuration)
            .ease(d3.easeLinear)
            .attr('x', d => x(d.value)+5)
            .attr('y', d => y(top_n+1)+5)
            .remove();

        yearText.html(~~year);

        if(year == 2018) ticker.stop();
        year = d3.format('.1f')((+year) + 0.1);

      },tickDuration);

    });

  end;

end;
Quite a lot of code, as it turns out, but reasonably easy to follow along and see what it is doing each step of
the way. There are other more concise examples of how to do this sort of thing in D3, but this version was
chosen mostly because of its relative simplicity. Each block of code more or less does one thing, and it is
laid out in such a way that adjusting attributes or other properties is easy enough and it isn't hard to figure
out where to make adjustments, if necessary. The end result is already here - an animated bar chart. Here's
what it looks like when it completes.
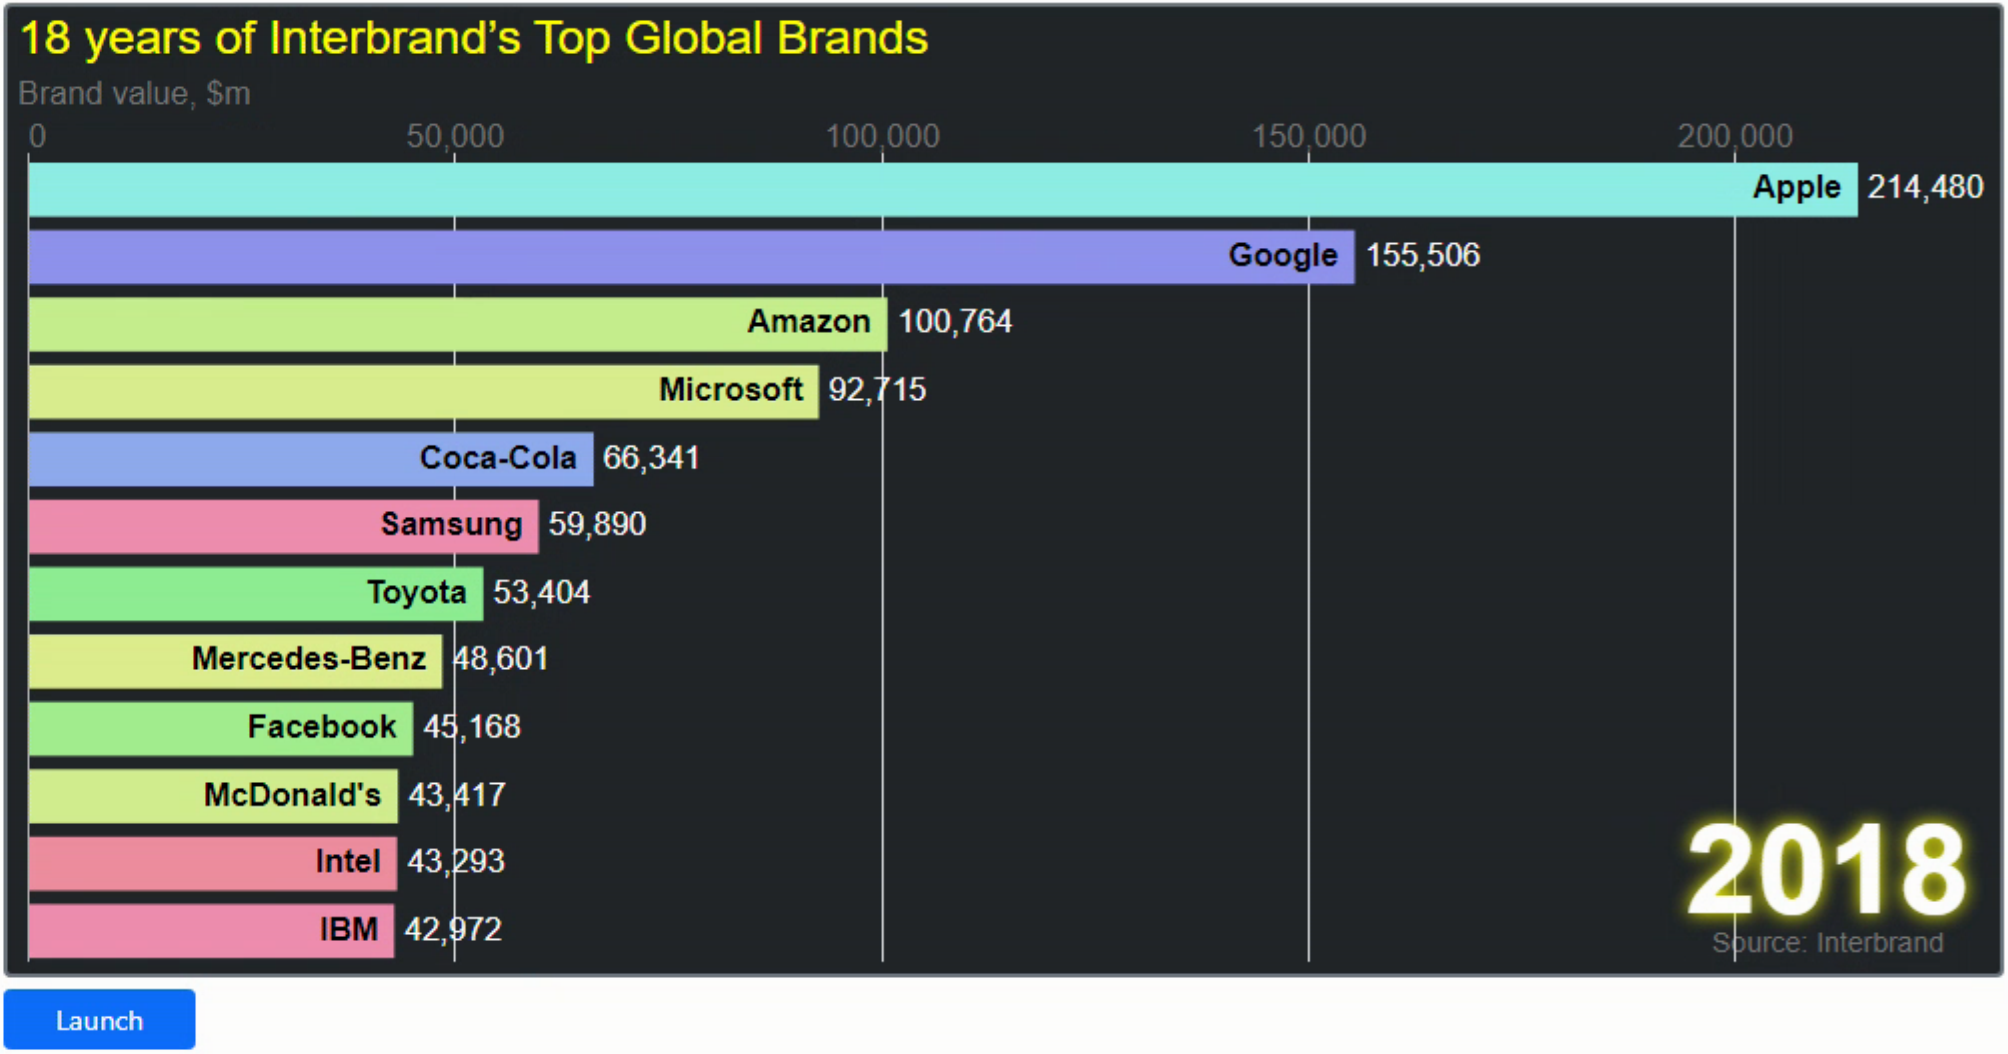
D3 Animated Bar Charts.
Note that the colors of the bars are chosen at random. Clicking the Launch button will restart the animation
with a different set of colors. Also note that if the browser tab containing the chart is not active, the
animation will pause.
Same Approach. Different Data.
Often, when coming up with examples like this, the biggest hurdle is coming up with example data to use. Naturally, if your project has data that is already in this kind of format, or can be massaged to be in this kind of format, then this is an easy thing for a developer to implement. But sometimes it helps to see how that massaging happens. So let's use the same chart code, more or less, but find another set of data to fit into it. Nothing too complicated.
Let's try historical country populations. A quick trip over to https://databank.worldbank.org/
and we can find all kinds of data. Here, we'll be looking at World Population Data. Selecting all countries
and then fiddling with the layout, we can get a dataset that looks something like the following.
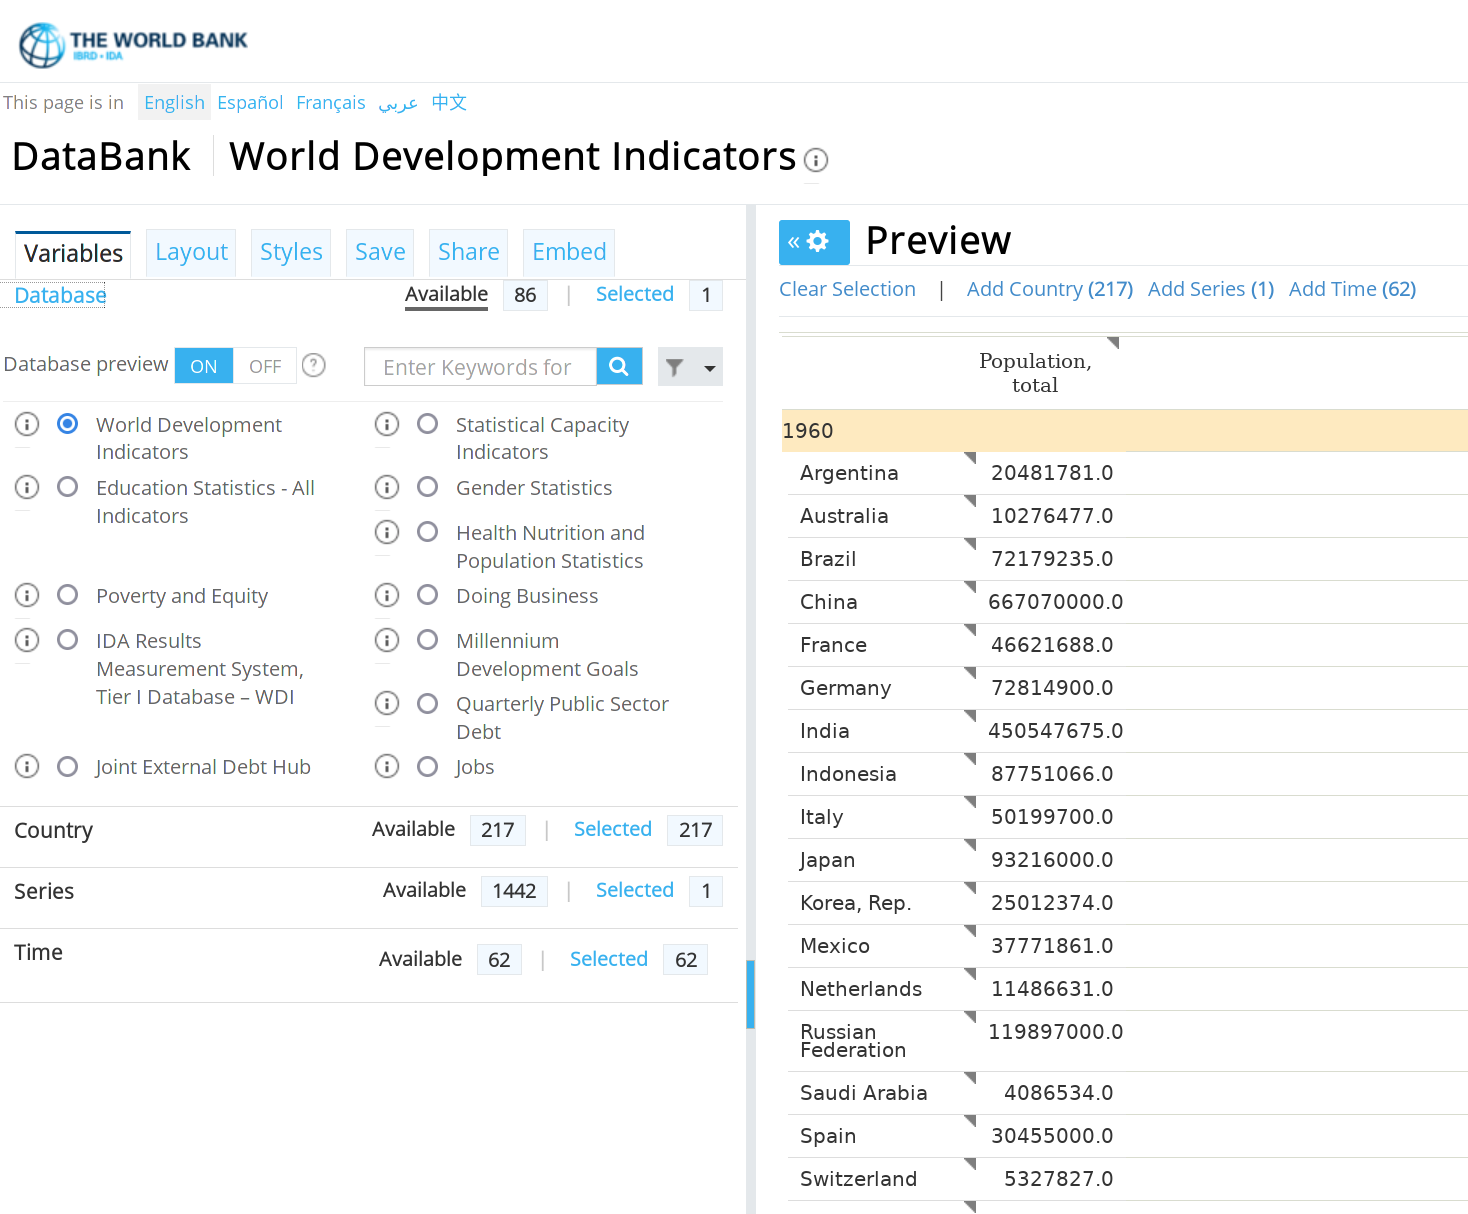
World Development Indicators.
When this is exported to a CSV file, we can change the headers to be similar to what we were using before. The
first bit of the CSV file then looks like the following.
year,Time Code,name,Country Code,value
1960,YR1960,Argentina,ARG,20481781
1960,YR1960,Australia,AUS,10276477
1960,YR1960,Brazil,BRA,72179235
1960,YR1960,China,CHN,667070000
1960,YR1960,France,FRA,46621688
The code remains largely the same, with a few tweaks to handle some issues. The data is aggregated by year
rather than 0.1 years. There is no "next value" in the data, so an attempt is made to calculate one. The range
of years is also different, 1960-2021. The dimensions were also adjusted to better accommodate the data being
presented. But, overall, not really any structural changes.
procedure TForm1.btnLaunch2Click(Sender: TObject);
begin

  asm
    divChart2Holder.innerHTML = '';

    var svg = d3.select('#divChart2Holder').append('svg')
      .attr('width', 1800)
      .attr('height', 500);

    var tickDuration = 200;
    var top_n = 10;
    var height = 500;
    var width = 1800;

    const margin = {
      top: 75,
      right: 75,
      bottom: 10,
      left: 10
    };

    let barPadding = (height-(margin.bottom+margin.top))/(top_n*5);

    let title = svg.append('text')
      .attr('class', 'title')
      .attr('x', 5)
      .attr('y', 24)
      .attr('fill','yellow')
      .html('60 years of World Bank Population Data');

    let subTitle = svg.append('text')
      .attr('class', 'subTitle')
      .attr('x', 5)
      .attr('y', 50)
      .html('Population');

    let caption = svg.append('text')
      .attr('class', 'caption')
      .attr('x', width-90)
      .attr('y', height-15)
      .style('text-anchor', 'middle')
      .html('Source: World Bank');

    let year = 1960;

    d3.csv('population_history.csv').then(function(data) {

      data.forEach(d => {
        d.value = +d.value,
        d.value = isNaN(d.value) ? 0 : d.value,
        d.year = +d.year,
        d.colour = d3.hsl(Math.random()*360,0.75,0.75),
        d.lastValue1 = data.filter(f => d.year == (f.year - 1) && f.name === d.name),
        d.lastValue = (d.lastValue1.length == 1) ? d.lastValue1[0].value : d.value
      });

      let yearSlice = data.filter(d => d.year == year && !isNaN(d.value))
        .sort((a,b) => b.value - a.value)
        .slice(0, top_n);

      yearSlice.forEach((d,i) => d.rank = i);

      let x = d3.scaleLinear()
        .domain([0, d3.max(yearSlice, d => d.value)])
        .range([margin.left, width-margin.right-65]);

      let y = d3.scaleLinear()
        .domain([top_n, 0])
        .range([height-margin.bottom, margin.top]);

      let xAxis = d3.axisTop()
        .scale(x)
        .ticks(width > 500 ? 5:2)
        .tickSize(-(height-margin.top-margin.bottom))
        .tickFormat(d => d3.format(',')(d));

      svg.append('g')
        .attr('class', 'axis xAxis')
        .attr('transform', `translate(0, ${margin.top})`)
        .call(xAxis)
        .selectAll('.tick line')
        .classed('origin', d => d == 0);

      svg.selectAll('rect.bar')
        .data(yearSlice, d => d.name)
        .enter()
        .append('rect')
        .attr('class', 'bar')
        .attr('x', x(0)+1)
        .attr('width', d => x(d.value)-x(0)-1)
        .attr('y', d => y(d.rank)+5)
        .attr('height', y(1)-y(0)-barPadding)
        .style('fill', d => d.colour);

      svg.selectAll('text.label')
        .data(yearSlice, d => d.name)
        .enter()
        .append('text')
        .attr('class', 'label')
        .attr('x', d => x(d.value)-8)
        .attr('y', d => y(d.rank)+5+((y(1)-y(0))/2)+1)
        .style('text-anchor', 'end')
        .html(d => d.name);

      svg.selectAll('text.valueLabel')
        .data(yearSlice, d => d.name)
        .enter()
        .append('text')
        .attr('class', 'valueLabel')
        .attr('x', d => x(d.value)+5)
        .attr('y', d => y(d.rank)+5+((y(1)-y(0))/2)+1)
        .attr('fill','white')
        .text(d => d3.format(',.0f')(d.lastValue));

      let yearText = svg.append('text')
        .attr('class', 'yearText')
        .attr('x', width - 90)
        .attr('y', height-35)
        .style('text-anchor', 'middle')
        .html(~~year)
        .attr('fill','white')
        .style('filter','drop-shadow(0px 0px 5px yellow)');

      let ticker = d3.interval(e => {

        yearSlice = data.filter(d => d.year == parseInt(year) && !isNaN(d.value))
          .sort((a,b) => b.value - a.value)
          .slice(0,top_n);

        yearSlice.forEach((d,i) => d.rank = i);

        console.log(yearSlice);

        x.domain([0, d3.max(yearSlice, d => d.value)]);

        svg.select('.xAxis')
          .transition()
          .duration(tickDuration)
          .ease(d3.easeLinear)
          .call(xAxis);

        let bars = svg.selectAll('.bar').data(yearSlice, d => d.name);

        bars
          .enter()
          .append('rect')
          .attr('class', d => `bar ${d.name.replace(/\s/g,'_')}`)
          .attr('x', x(0)+1)
          .attr('width', d => x(d.value)-x(0)-1)
          .attr('y', d => y(top_n+1)+5)
          .attr('height', y(1)-y(0)-barPadding)
          .style('fill', d => d.colour)
          .transition()
            .duration(tickDuration)
            .ease(d3.easeLinear)
            .attr('y', d => y(d.rank)+5);

        bars
          .transition()
            .duration(tickDuration)
            .ease(d3.easeLinear)
            .attr('width', d => x(d.value)-x(0)-1)
            .attr('y', d => y(d.rank)+5);

        bars
          .exit()
          .transition()
            .duration(tickDuration)
            .ease(d3.easeLinear)
            .attr('width', d => x(d.value)-x(0)-1)
            .attr('y', d => y(top_n+1)+5)
            .remove();

        let labels = svg.selectAll('.label')
          .data(yearSlice, d => d.name);

        labels
          .enter()
          .append('text')
          .attr('class', 'label')
          .attr('x', d => x(d.value)-8)
          .attr('y', d => y(top_n+1)+5+((y(1)-y(0))/2))
          .style('text-anchor', 'end')
          .html(d => d.name)
          .transition()
            .duration(tickDuration)
            .ease(d3.easeLinear)
            .attr('y', d => y(d.rank)+5+((y(1)-y(0))/2)+1);

           labels
          .transition()
            .duration(tickDuration)
            .ease(d3.easeLinear)
            .attr('x', d => x(d.value)-8)
            .attr('y', d => y(d.rank)+5+((y(1)-y(0))/2)+1);

        labels
          .exit()
          .transition()
            .duration(tickDuration)
            .ease(d3.easeLinear)
            .attr('x', d => x(d.value)-8)
            .attr('y', d => y(top_n+1)+5)
            .remove();

        let valueLabels = svg.selectAll('.valueLabel').data(yearSlice, d => d.name);

        valueLabels
          .enter()
          .append('text')
            .attr('class', 'valueLabel')
            .attr('x', d => x(d.value)+5)
            .attr('y', d => y(top_n+1)+5)
            .attr('fill','white')
            .text(d => d3.format(',.0f')(d.lastValue))
            .transition()
              .duration(tickDuration * 10)
              .ease(d3.easeLinear)
              .attr('y', d => y(d.rank)+5+((y(1)-y(0))/2)+1);

        valueLabels
          .transition()
            .duration(tickDuration)
            .ease(d3.easeLinear)
            .attr('x', d => x(d.value)+5)
            .attr('y', d => y(d.rank)+5+((y(1)-y(0))/2)+1)
            .tween("text", function(d) {
              let i = d3.interpolateRound(d.lastValue, d.value);
              return function(t) {
                this.textContent = d3.format(',')(i(t));
              };
            });

        valueLabels
          .exit()
          .transition()
            .duration(tickDuration)
            .ease(d3.easeLinear)
            .attr('x', d => x(d.value)+5)
            .attr('y', d => y(top_n+1)+5)
            .remove();

        yearText.html(~~year);

        if(year == 2021) ticker.stop();
        year = d3.format('.1f')((+year) + 1);

      },tickDuration);

    });

  end;
end;
And this gets us to the following animated chart.
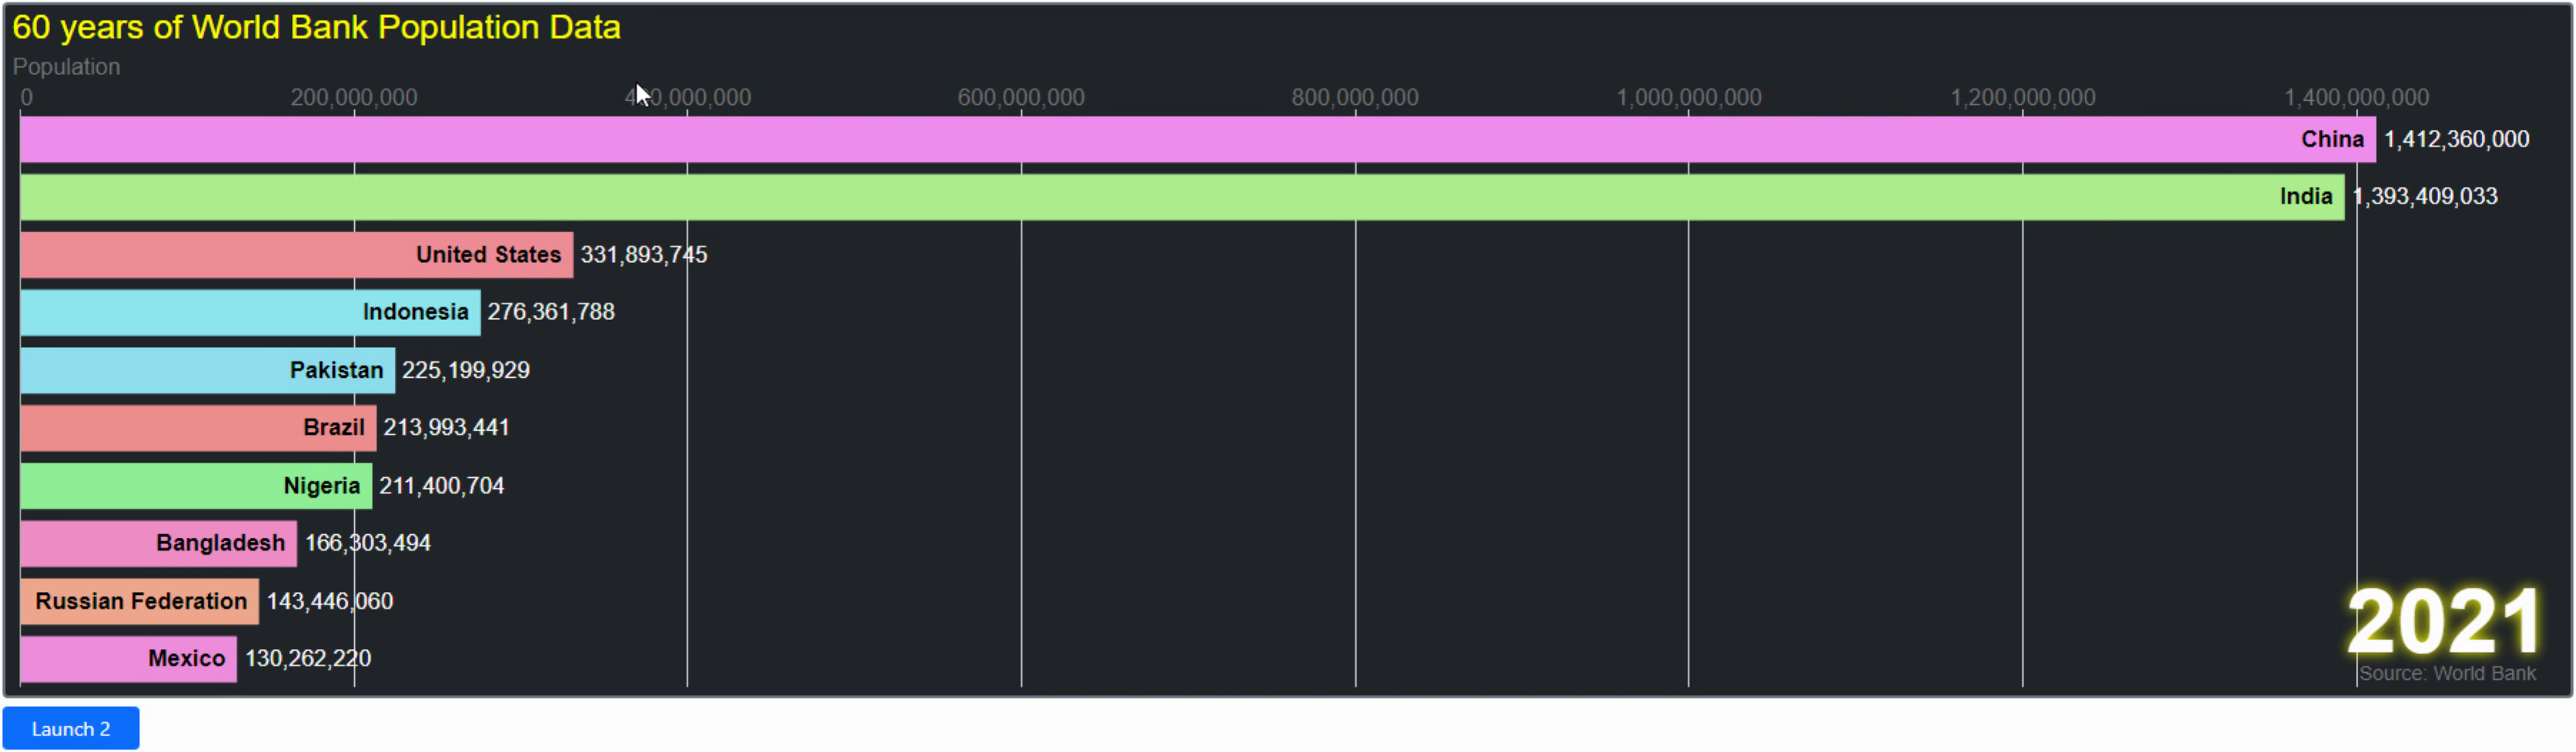
Population Animation.
Download the full source code sample project here.
Other Animation Examples.
There are numerous D3 examples available, almost always with the underlying source code included. With a
little luck, and perhaps a little persistence, most of these can be incorporated into a TMS WEB Core project
using the same sort of approach. The older examples tend to work better as the D3 organization has moved into a
newer template for their examples. With this template, you can make changes directly on the page and have those
changes reflected immediately. But this uses something they refer to as "workbooks" and their "Observable
API". And while this is exportable as JavaScript, it relies on a number of supporting libraries that are really
geared towards Node.js. Depending on the complexity, this may be an easy thing to
overcome, or it might be more trouble than it is worth. Older examples tend to use Vanilla JavaScript and are thus much
easier to incorporate, as we've been doing here.
Next Time: Tag Clouds.
Our last charting topic will cover a few different ways to generate "tag clouds" (sometimes referred to as "word clouds"), both in D3 and in Chart.js.
Related Posts
Charting Part 1: Sparklines
Charting Part 2: Chart.js
Charting Part 3: D3.js Introduction
Charting Part 4: D3.js Interaction
Charting Part 5: D3.js Animation
Charting Part 6: Tag Clouds
Follow Andrew on 𝕏 at @WebCoreAndMore or join our 𝕏 Web Core and More Community.
Andrew Simard

This blog post has not received any comments yet.
All Blog Posts | Next Post | Previous Post