Blog
All Blog Posts | Next Post | Previous Post

 Extend TMS WEB Core with JS Libraries with Andrew:
Diagrams with Draw.io
Tuesday, August 9, 2022

In the past couple of posts, we've had a look at JS libraries that enabled us to annotate images in some way. With Leaflet, we could draw boundaries and other shapes. With Filerobot Image Editor, we could add annotations of various kinds, including shapes, text, other images, and so on. But what if we wanted to incorporate a full-on diagramming tool into our TMS WEB Core projects? We've got some options here. There are a number of such libraries available, including of course the very capable cross-platform TMS FNC Blox product, that provides the user with the ability to create diagrams, flowcharts, and similar documents. Today we're going to have a look at Draw.io (aka https://app.diagrams.net). More than just a JavaScript library, it is actually a full-blown web application in its own right. But we can embed it directly into our projects and treat it much the same way as other JavaScript libraries we've encountered so far.
Motivation.
With websites like https://app.diagrams.net being freely available, and with tools like Visio still lurking in the shadows all these years, why do we need to incorporate diagramming tools at all? Well, sometimes it might be a matter of convenience to have such a tool integrated into our projects. Sometimes it might be more than a convenience if access to the contents of such diagrams needs to be more strictly controlled. And there's also the opportunity to customize the integration of a given diagramming tool in a way to make it more useful to a particular project. And some offer deeper integration than others. For example, if you're looking to have diagram content generated by your application, then something like FNC Blox is likely going to be a better candidate than Draw.io might be. Similarly, if you're looking for a capable diagramming tool but don't generally have a need to access the contents of the diagrams programmatically, then perhaps Draw.io is the tool for you. As always, we're all about options here.
Getting Started.
In the JavaScript libraries we've covered so far, getting started is usually just a matter of adding some links to our Project.html file and then connecting a TWebHTMLDiv component to the JavaScript library in some fashion. For Draw.io, it is an entire application already, so we need to use something like an <iframe> to embed it in our application, and then we can pass messages back and forth to provide the integration that we need for loading and saving data, adding custom shape libraries and so on. There's a special 'embed' build of Draw.io freely available for exactly this purpose - a web service in effect - that allows us to embed the Draw.io application directly into our project.
So let's give it a try. The basics of what follows have been adapted for our TMS WEB Core project from their Simple draw.io embedding walk-through document. Their example is simple enough conceptually. Just an image on a page that, when double-clicked, gets loaded into the Draw.io web application. There's an awful lot going on though, much of which isn't necessarily obvious the first time through.We'll start with the usual TMS WEB Bootstrap Application template, and then add a pair of TWebHTMLDiv components called divImage and divDrawIO, to hold the sample image and the Draw.io application, respectfully. And we'll need to get an image to load. There's an empty-drawio.png image that has been created for this project that we'll use and, as its name implies, this is just an empty image. It would seem that Draw.io isn't particularly happy when not having an image to work with, so this will help.
The source code for the project, to start with, looks like this. Most of the code is taken from the walk-through example above. There's an extra section where we load the empty image and convert it to a "data URI" which we then add to an <img> tag within the divImage component. We'll go into why this is interesting very shortly, but it is one of those things that seems to be a lot harder than it needs to be. But it works, so we don't have to think about it too much at the moment. Note that we don't need to do anything at all in our Project.html file.
unit Unit1;

interface

uses
  System.SysUtils, System.Classes, JS, Web, WEBLib.Graphics, WEBLib.Controls,
  WEBLib.Forms, WEBLib.Dialogs, Vcl.Controls, WEBLib.WebCtrls;

type
  TForm1 = class(TWebForm)
    divImage: TWebHTMLDiv;
    divDrawIO: TWebHTMLDiv;
    procedure WebFormCreate(Sender: TObject);
  private
    { Private declarations }
  public
    { Public declarations }
  end;

var
  Form1: TForm1;

implementation

{$R *.dfm}

procedure TForm1.WebFormCreate(Sender: TObject);
begin

  asm
    // This is what we're calling, essentially the app that will live in in our iframe
    var url = 'https://embed.diagrams.net';
    var params = '/?embed=1'+
                 '&proto=json';


    // Lot of trouble just to get a Data URI, but here we are
    const getBase64FromUrl = async (url) => {
      const data = await fetch(url);
      const blob = await data.blob();
      return new Promise((resolve) => {
        const reader = new FileReader();
        reader.readAsDataURL(blob);
        reader.onloadend = () => {
          const base64data = reader.result;
          resolve(base64data);
        }
      });
    }
    (async () => {
      var emptyURI = await getBase64FromUrl('empty-drawio.png');
      divImage.innerHTML = '<img id="drawio" class="drawio" style="position:absolute; width:100%; top:0; bottom:0; margin:auto;" src='+emptyURI+'>';
    })();


    // This will load the diagram into the editor when double-clicked
    document.addEventListener('dblclick', function(evt)
    {

      // Check that we double-clicked on something we want to load
      var source = evt.srcElement || evt.target;
      if (source.nodeName == 'IMG' && source.className == 'drawio') {

        // One way to get rid of the contents of a previous DrawIO session
        divDrawIO.innerHTML = '';

        // This is how we communicate with the app
        var receive = function(evt) {

          // Check that we got a message from the expected source
          if (evt.data.length > 0 && evt.origin == url) {

            // messages are formatted as JSON (see params above)
            var msg = JSON.parse(evt.data);

            // Received when the editor has been initialized, and is the
            // prompt we need to tell it what image we want it to load
            if (msg.event == 'init') {
              evt.source.postMessage(JSON.stringify(
                {action: 'load', xmlpng: source.src}), '*');
            }

            // Received if the user clicks save
            else if (msg.event == 'save')
            {
              // Sends a request to export the diagram as XML with embedded PNG
              evt.source.postMessage(JSON.stringify(
                {action: 'export', format: 'xmlpng', spinKey: 'saving'}), '*');
            }

            // Received if the export request was processed
            else if (msg.event == 'export')
            {
              // Updates the data URI of the image
              window.removeEventListener('message', receive);
              var img = document.getElementById('drawio');
              img.setAttribute('src', msg.data);
            }

            // Received if the user clicks exit or after export
            if (msg.event == 'exit' || msg.event == 'export')
            {
              // Closes the editor
              var editor = document.getElementById('divDrawIO');
              editor.innerHTML = '';
            }
          }
        };

        // Launches the editor
        window.addEventListener('message', receive);
        var iframe = document.createElement('iframe');
        iframe.setAttribute('frameborder', '0');
        iframe.setAttribute('src', url+params);
        iframe.setAttribute('style','position:absolute; width:100%; height:100%');
        divDrawIO.appendChild(iframe);
      }
    })

  end;

end;

end.
The gist of the code is that after we get a double-click event, we check that the image has the "drawio" class assigned, and then create a new <iframe> and add it to the (TWebHTMLDiv) divDrawIO component. We also create a "receive" event and link it to the <iframe> using an addEventListener function call. This is used to receive messages in our TMS WEB Core application from the Draw.io application that is running inside of the <iframe>. We can use postMessage to send messages the other way.
When the Draw.io application first starts, it issues an "init" message, which we then respond to by giving it a "load" message with the details of the file to be loaded. Likewise, when the user selects one of the "save" or "exit" functions within the Draw.io application, there are messages passed back to our receive function which will allow us to take the appropriate steps. It might seem a little complicated at first. The documentation link above has a diagram that explains how this communication works.
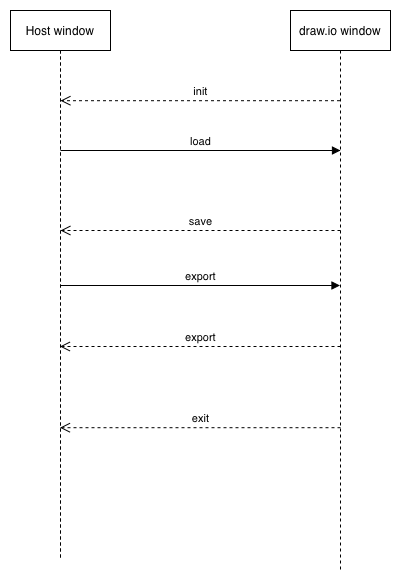
Draw.io Message Passing.
When the application launches, there are two blank areas to start with. Double-clicking the left blank area (the
image placeholder) will then launch Draw.io in an <iframe> and load the blank image. Should look something
like this.
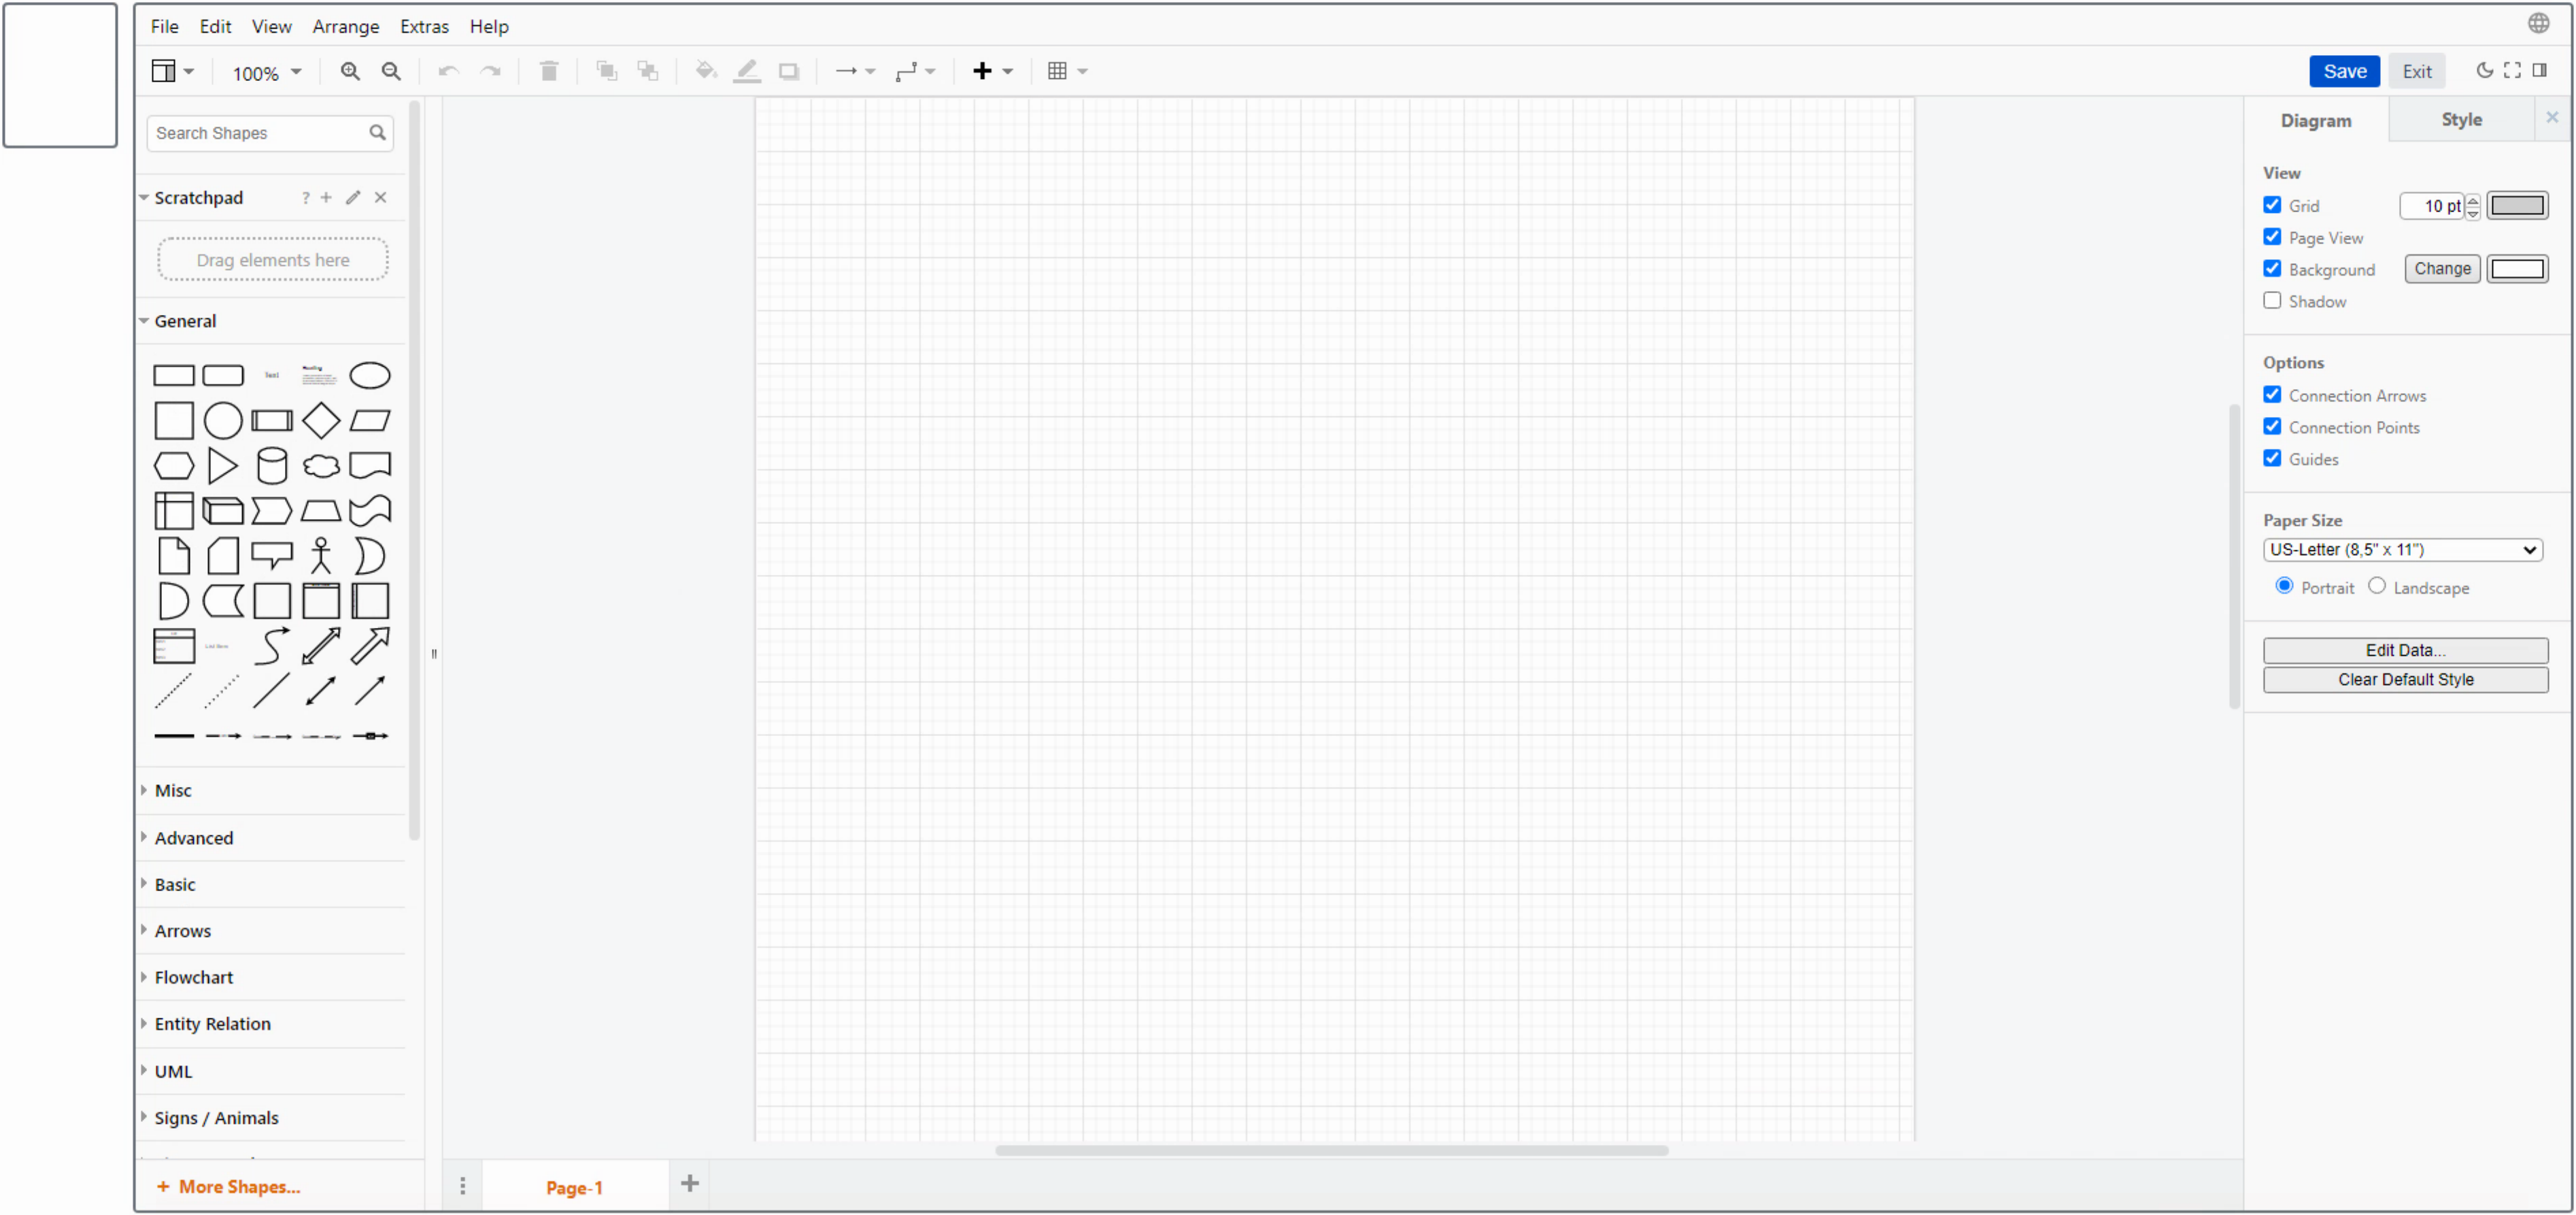
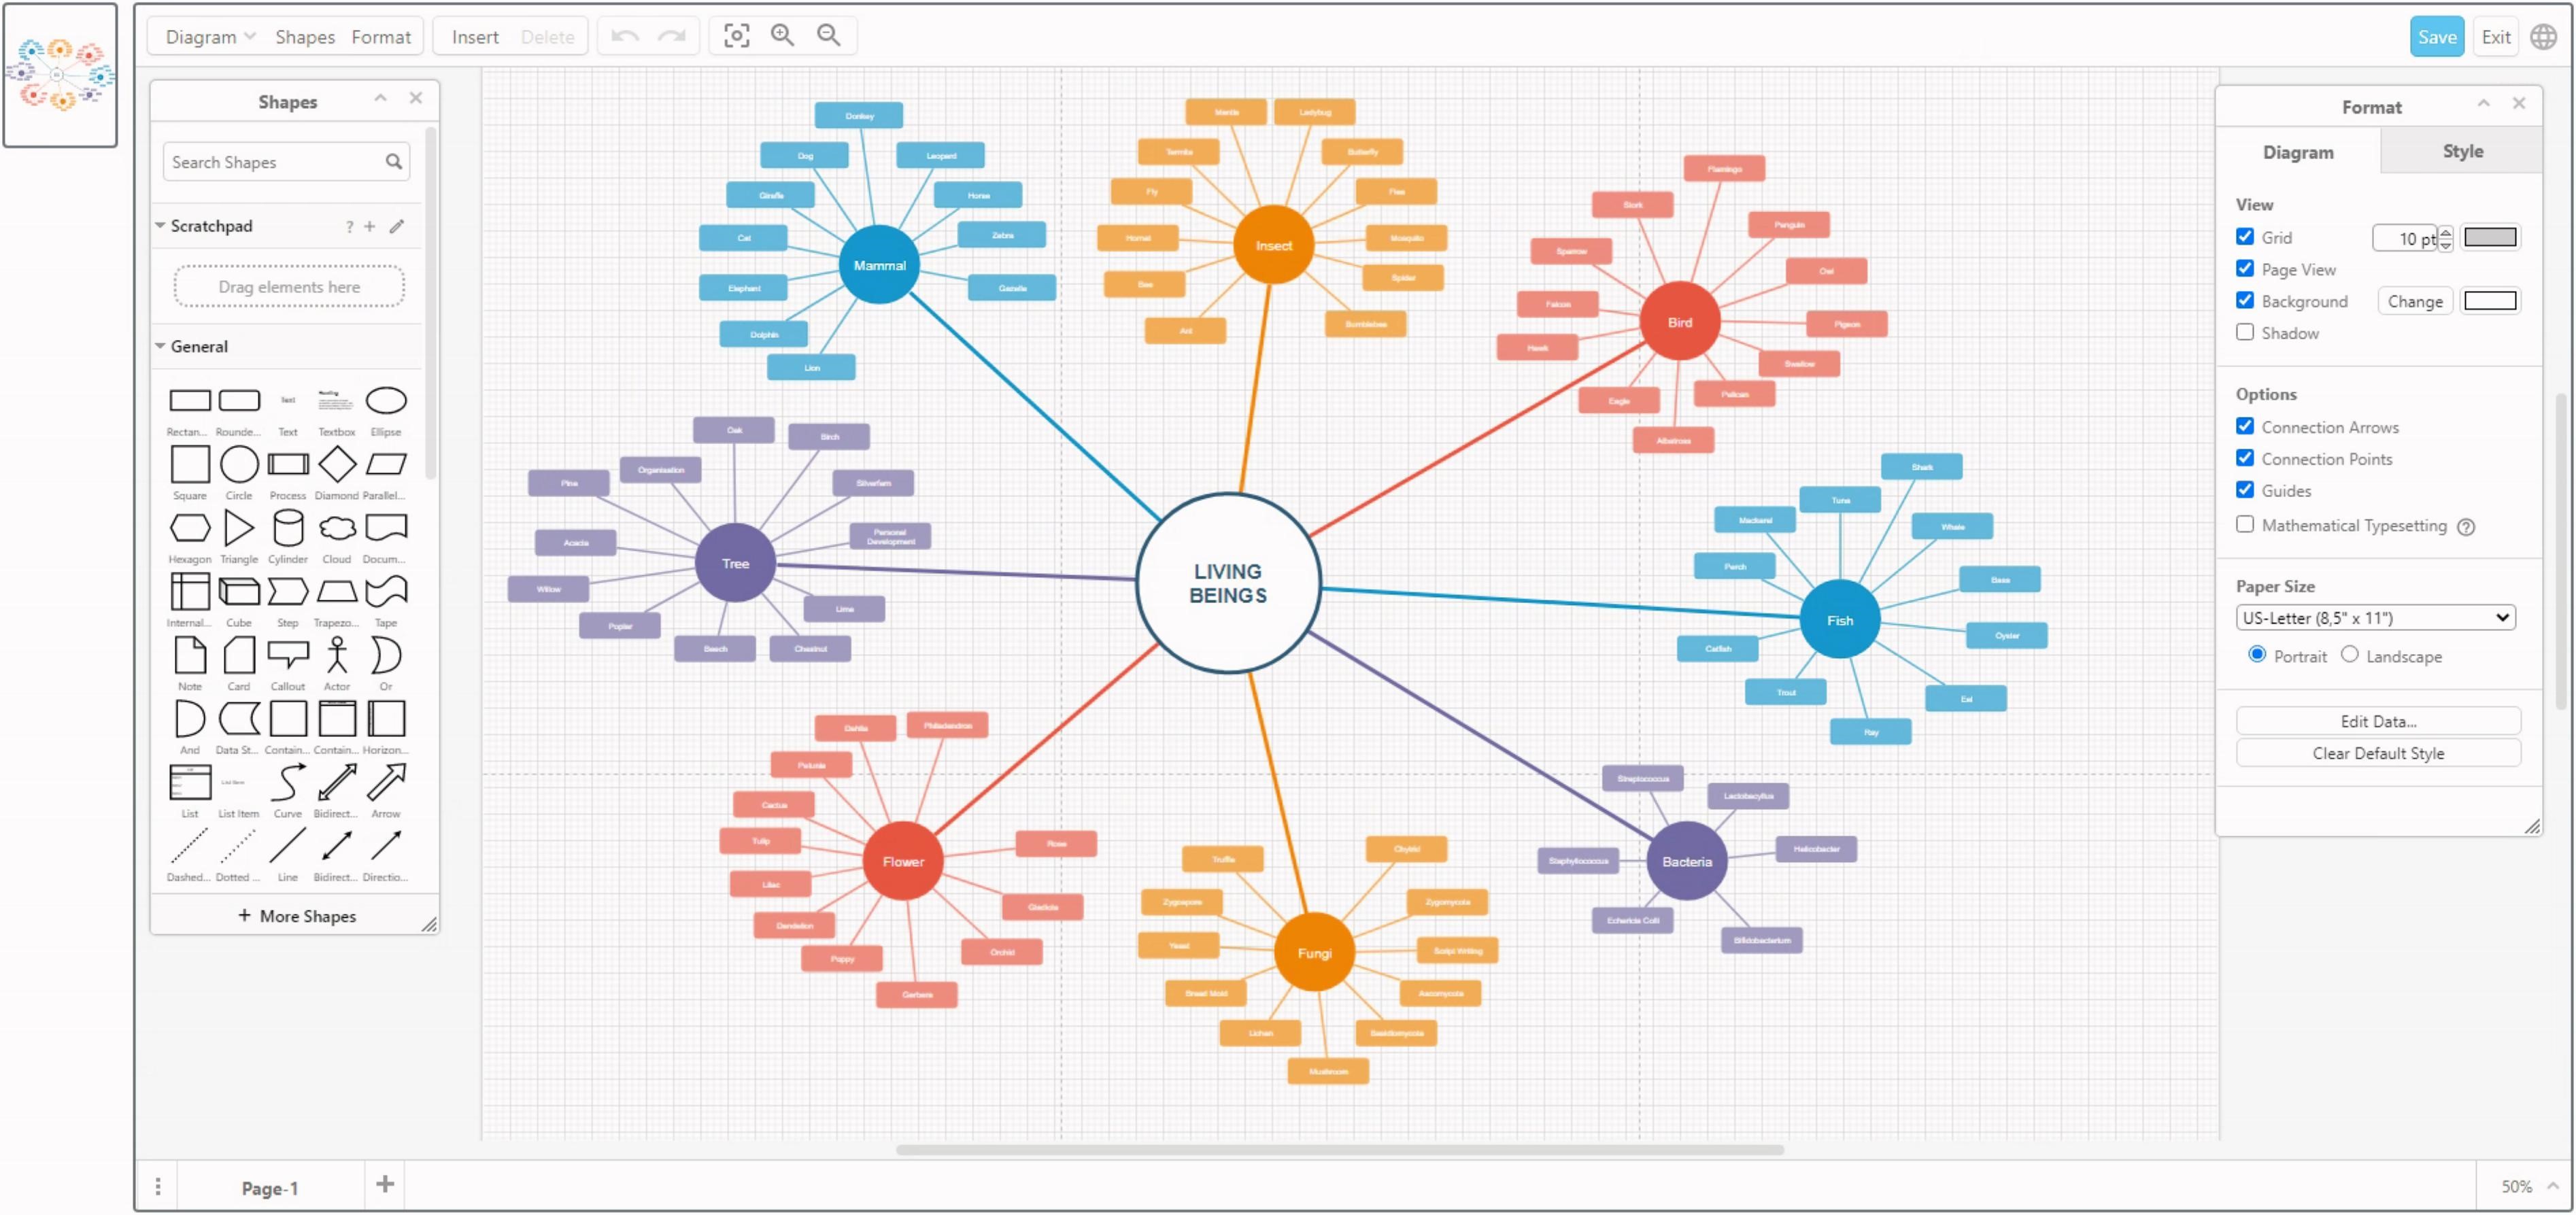
Draw.io Default Configuration.
Nothing special has been done in terms of the styling or configuration of Draw.io in this case, this is just what
it looks like by default. If we play around a bit and add some content to the diagram and then save it, the image
on the left will be updated with the new content. Double-clicking on it will then load that updated content for
subsequent editing.
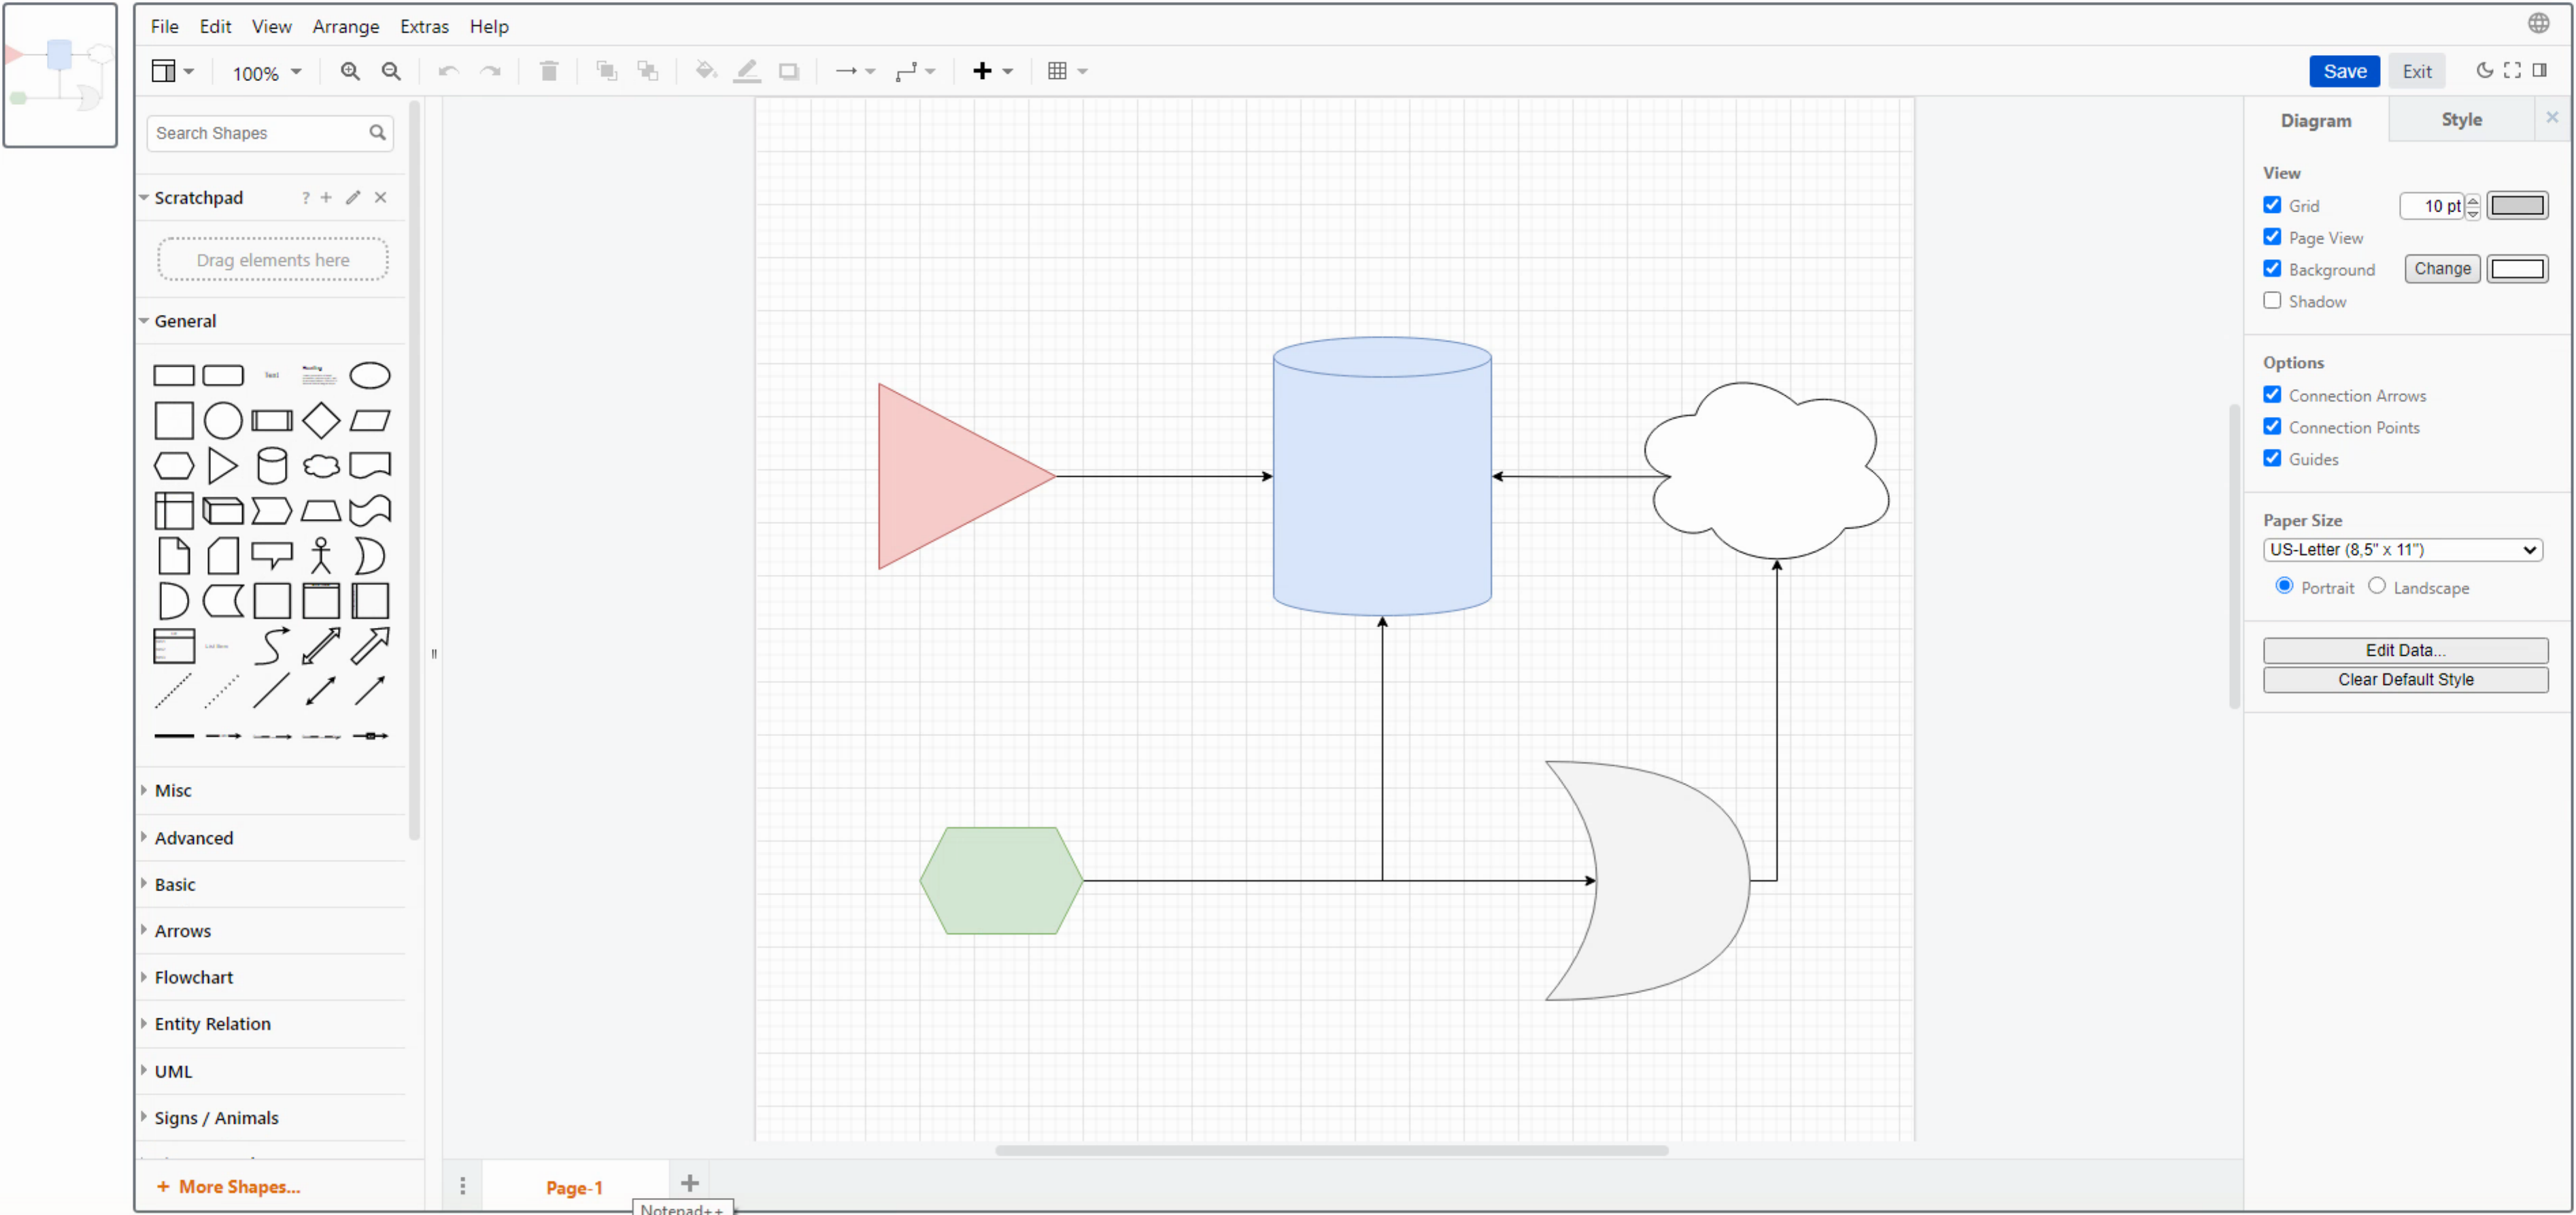
There are quite a number of shape libraries to choose from by default, and dozens more are available by clicking on the + More Shapes... button at the bottom left. Everything from electrical cabinet components to office floor plans to ERDs and more. Lots to choose from right out of the gate.
About That Empty PNG File.
That all works pretty well without too much trouble. But there are a few other things going on here that we'll need to get a handle on before we get ahead of ourselves. Draw.io does something a little bit fun where the diagram definition (something akin to XML in this case) is embedded as text in a special section of the PNG file. It does this with SVG and PDF files, too. So while the PNG file can be used like any other PNG file might, this extra bit of data tagging along inside is important. It is compressed and encoded, so not easily something to get out of the PNG file, but we can see what it looks like while editing a file just by using the Extras / Edit Diagram menu. For our example above, this looks like the following.
<mxGraphModel dx="1292" dy="768" grid="1" gridSize="10" guides="1" tooltips="1" connect="1" arrows="1" fold="1" page="1" pageScale="1" pageWidth="850" pageHeight="1100" background="#ffffff" math="0" shadow="0">
  <root>
    <mxCell id="0" />
    <mxCell id="1" parent="0" />
    <mxCell id="4" style="edgeStyle=orthogonalEdgeStyle;rounded=0;orthogonalLoop=1;jettySize=auto;html=1;entryX=0;entryY=0.5;entryDx=0;entryDy=0;entryPerimeter=0;" parent="1" source="2" target="3" edge="1">
      <mxGeometry relative="1" as="geometry" />
    </mxCell>
    <mxCell id="2" value="" style="triangle;whiteSpace=wrap;html=1;fillColor=#f8cecc;strokeColor=#b85450;" parent="1" vertex="1">
      <mxGeometry x="90" y="215" width="130" height="140" as="geometry" />
    </mxCell>
    <mxCell id="3" value="" style="shape=cylinder3;whiteSpace=wrap;html=1;boundedLbl=1;backgroundOutline=1;size=15;fillColor=#dae8fc;strokeColor=#6c8ebf;" parent="1" vertex="1">
      <mxGeometry x="380" y="180" width="160" height="210" as="geometry" />
    </mxCell>
    <mxCell id="7" style="edgeStyle=orthogonalEdgeStyle;rounded=0;orthogonalLoop=1;jettySize=auto;html=1;entryX=0.25;entryY=0.5;entryDx=0;entryDy=0;entryPerimeter=0;" parent="1" source="5" target="6" edge="1">
      <mxGeometry relative="1" as="geometry" />
    </mxCell>
    <mxCell id="8" style="edgeStyle=orthogonalEdgeStyle;rounded=0;orthogonalLoop=1;jettySize=auto;html=1;entryX=0.5;entryY=1;entryDx=0;entryDy=0;entryPerimeter=0;" parent="1" source="5" target="3" edge="1">
      <mxGeometry relative="1" as="geometry" />
    </mxCell>
    <mxCell id="5" value="" style="shape=hexagon;perimeter=hexagonPerimeter2;whiteSpace=wrap;html=1;fixedSize=1;fillColor=#d5e8d4;strokeColor=#82b366;" parent="1" vertex="1">
      <mxGeometry x="120" y="550" width="120" height="80" as="geometry" />
    </mxCell>
    <mxCell id="12" style="edgeStyle=orthogonalEdgeStyle;rounded=0;orthogonalLoop=1;jettySize=auto;html=1;entryX=0.55;entryY=0.95;entryDx=0;entryDy=0;entryPerimeter=0;exitX=1;exitY=0.5;exitDx=0;exitDy=0;exitPerimeter=0;" parent="1" source="6" target="10" edge="1">
      <mxGeometry relative="1" as="geometry" />
    </mxCell>
    <mxCell id="6" value="" style="shape=xor;whiteSpace=wrap;html=1;fillColor=#f5f5f5;fontColor=#333333;strokeColor=#666666;" parent="1" vertex="1">
      <mxGeometry x="580" y="500" width="150" height="180" as="geometry" />
    </mxCell>
    <mxCell id="13" value="" style="edgeStyle=orthogonalEdgeStyle;rounded=0;orthogonalLoop=1;jettySize=auto;html=1;exitX=0.16;exitY=0.55;exitDx=0;exitDy=0;exitPerimeter=0;" parent="1" source="10" target="3" edge="1">
      <mxGeometry relative="1" as="geometry" />
    </mxCell>
    <mxCell id="10" value="" style="ellipse;shape=cloud;whiteSpace=wrap;html=1;" parent="1" vertex="1">
      <mxGeometry x="640" y="200" width="200" height="155" as="geometry" />
    </mxCell>
  </root>
</mxGraphModel>
Not too hard to see that there are elements for each shape and connector in the diagram. This block of text is included in the PNG file and is extracted again when the PNG file is loaded. This means we have to be a little bit careful about what we do with that PNG file, to ensure that this data isn't lost. Likewise, for SVG and PDF files - there's an option when creating all three to "include a copy of my diagram" which then results in this definition being included.
Our empty PNG file is one such example, where it walks and talks like a regular PNG file, but this extra payload means that it is a little bigger than you'd expect for an empty PNG file (810 bytes instead of 119 bytes). Not enough to worry about. Where this becomes more important is when you want to load up data and convert it into a Data URI.
So what's a Data URI? This refers to a "Uniform Resource Identifier" which is a mechanism that allows data to be directly embedded in an HTML web page or even in a CSS file. Sometimes confused with a URL, where a URL is a subset of a URI, a "Uniform Resource Locator" that indicates where something is. In our example, when we pass the diagram back and forth with the Draw.io application, we're passing it directly as a Data URI.
A Data URI that has been defined as an image type can be displayed directly in an <img> element by assigning it to the src attribute, much like you would do with an image URL. If you were to inspect such an <img> element, you'd see the src attribute has a value that starts with something like "data:image/png;base64,iVBORw0K....." instead of a normal URL. Note that there aren't any particular limits to the size of a Data URI and that they are typically base64 encoded.
When our application first starts, it loads the "empty-drawio.png" file and converts it into a Data URI, and then adds that to an <img> element. This is also why it appears blank initially. If you were to do a Google search for how to convert an image to a Data URI as we've done here, there are numerous examples that take a different approach. They create a <canvas> element and then draw the image you want to load into that canvas. And then use the <canvas> element to create the Data URI of whatever dimensions the <canvas> element was set to.
It isn't hard to see how this might be problematic in our case, as it is likely that the extra data in the PNG (the diagram definition) would not be included in the Data URI generated in this way. Likewise, if you were to load up the PNG file into an image editor and then resize it or alter it, the diagram definition might be lost or might become inconsistent with the image.
We've Got Some Options.
With that out of the way, let's have a look at some of the configuration options available. We're already using two, "embed=1" and "proto=json", which appear near the very beginning of our TWebFormCreate procedure. The available parameters can be found here and slightly different lists can be found here and also here. Documentation for Draw.io at this level isn't spectacular but there's enough information there to sort out what we need. We'll cover those parameters that are most likely to be of interest below.
The "embed" parameter is used to tell Draw.io that it is being embedded in a page (or in an <iframe> as in our case) and that we want to enable the ability to pass messages back and forth, and also that we'll be responsible for diagram storage. This is also the mode used exclusively with the "https://embed.diagrams.net" URL. You could, alternatively, load up the regular version of Draw.io which has other capabilities, like various kinds of cloud storage built-in, but potentially without the ability to make configuration adjustments or send or receive messages to get the diagram data from the application.
The "proto=json" parameter just tells Draw.io that we'll be sending and receiving information using JSON rather than XML as part of the communications protocol. They explicitly recommend leaving this as-is, and as we're fans of JSON around these parts, there's little reason to change it.
Likely the most interesting parameter is the "ui" parameter, which is used to change the overall theme of the Draw.io application. We'll use a different theme in each of the screenshots that follow, as well as Example Draw.io Diagrams to show what these look like. The available "ui" options currently include "kennedy", "min", "atlas", "dark" and "sketch". The default is "kennedy" which we've already seen. Here's an example of "atlas".
    var params = '/?embed=1'+
                 '&ui=atlas'+
                 '&proto=json';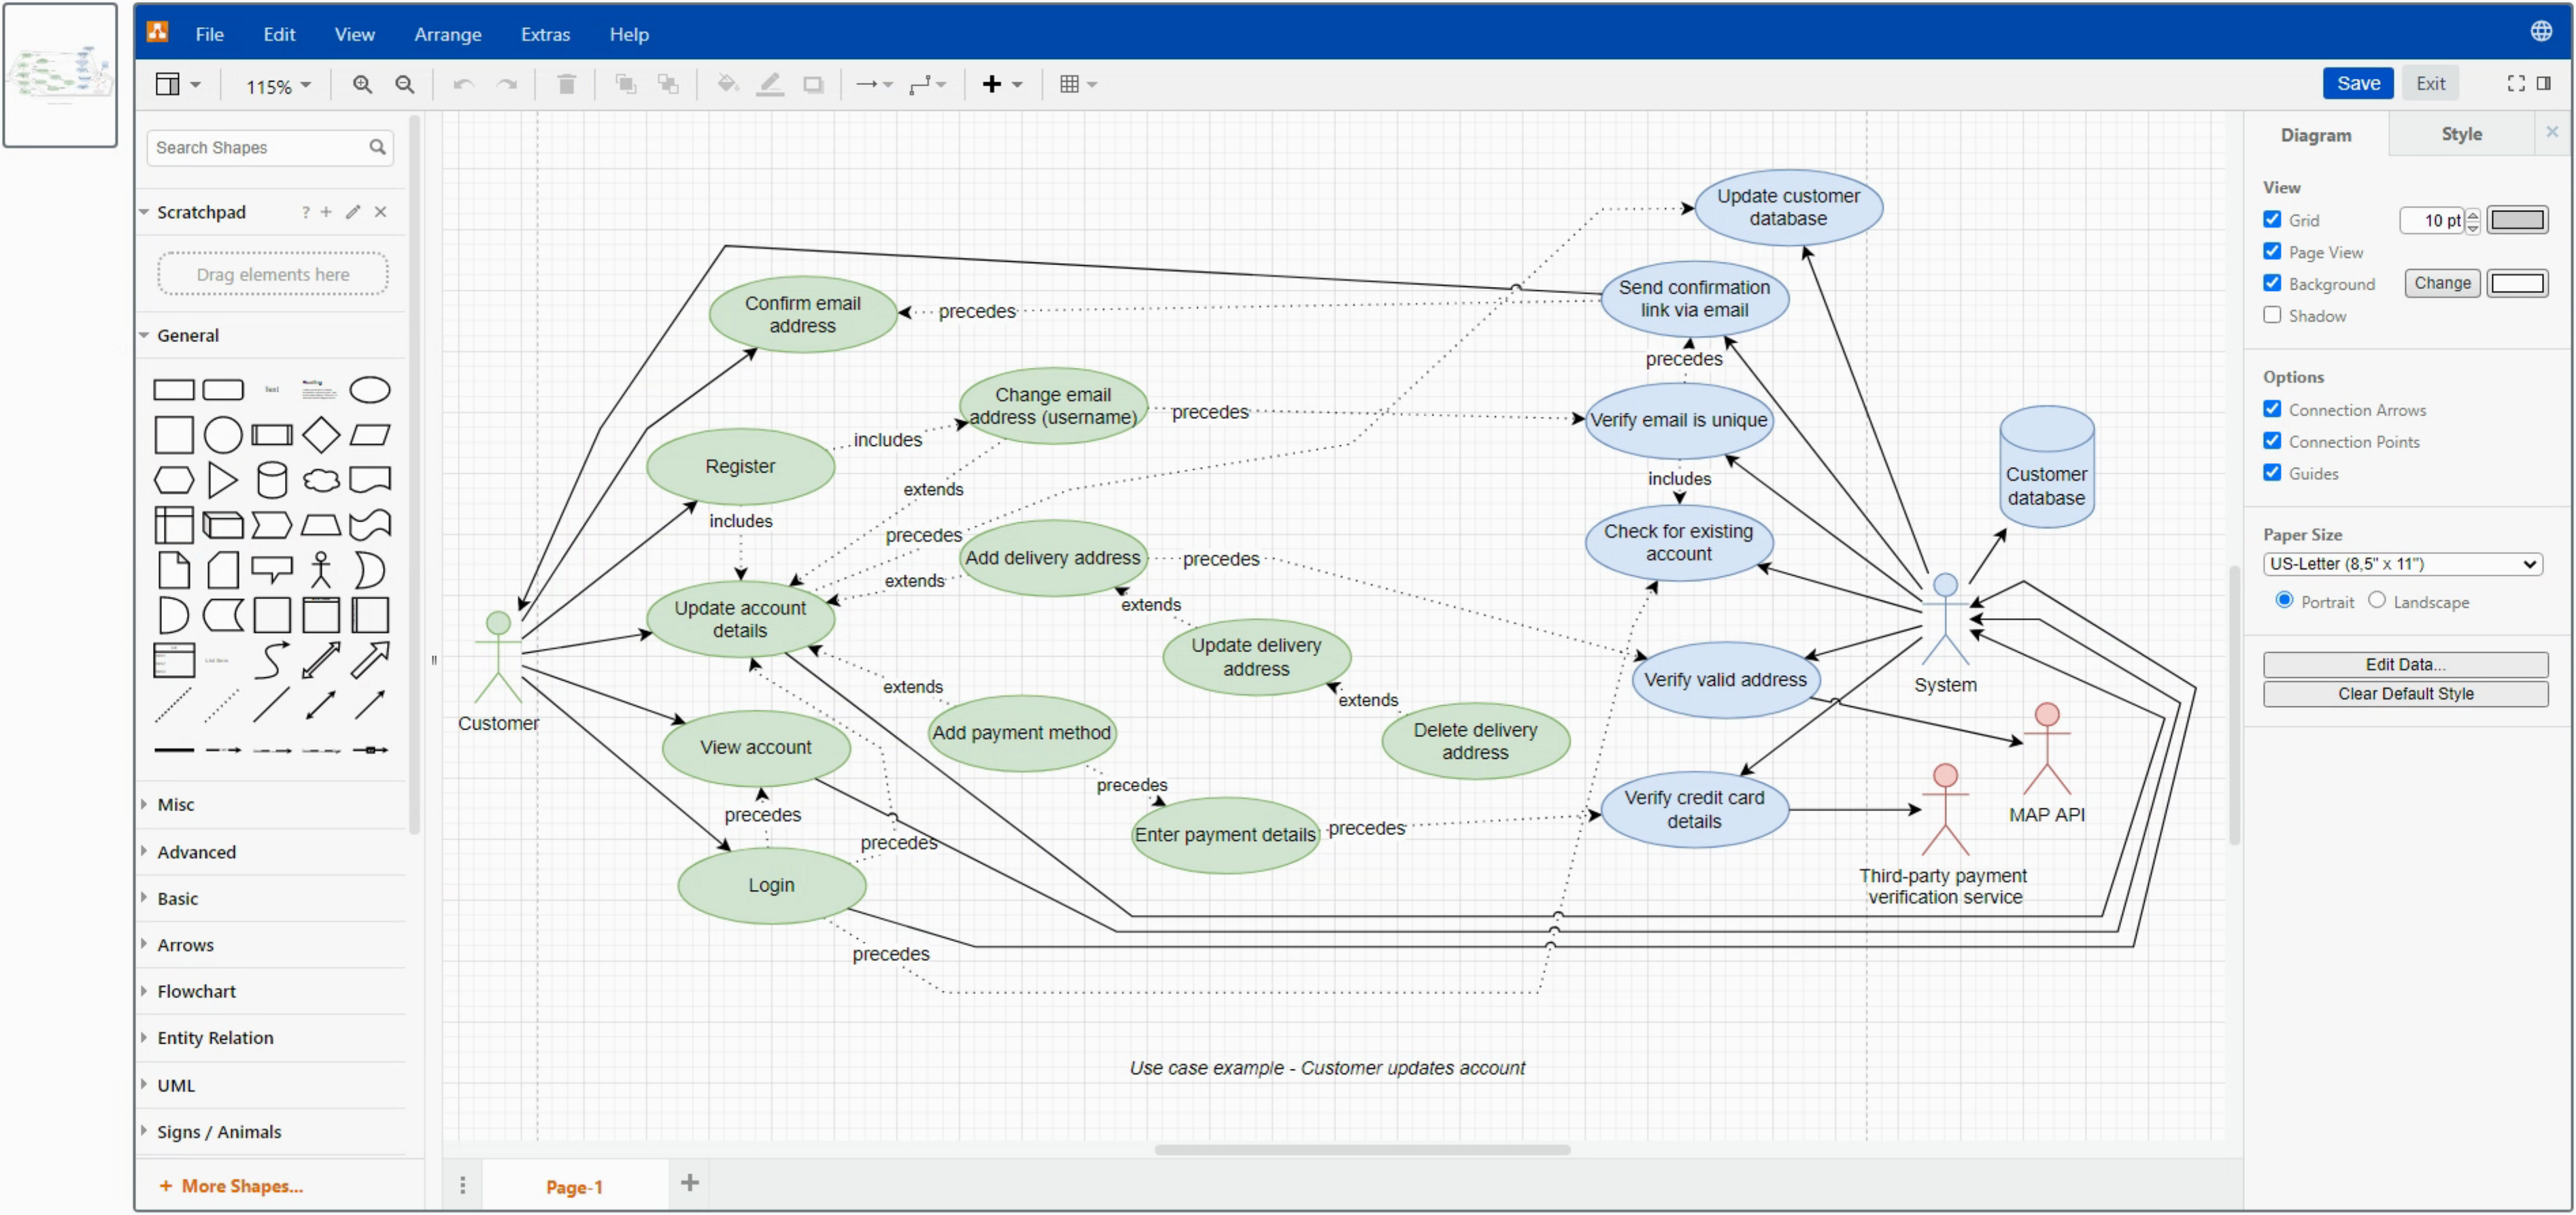
Draw.io Atlas Theme, UML Example Diagram.
Here's an example of the "min" theme where most of the interface is tucked away. Likely a good choice when only a bit of light editing is typically called for.
Draw.io Min Theme, Mind Map Example Diagram.
Several parameters are used to control how the save and exit buttons work, which buttons are visible, and so on. Let's say we want to have a "Save and Exit" and an "Exit" button. We could set up the parameters like this.
    var params = '/?embed=1'+
                 '&ui=dark'+
                 '&saveAndExit=1'+
                 '&noSaveBtn=1'+
                 '&proto=json';
Now, the window will be closed automatically whether the diagram is saved or discarded, which is actually what it
was doing by default anyway, just now the buttons more accurately reflect what they do.
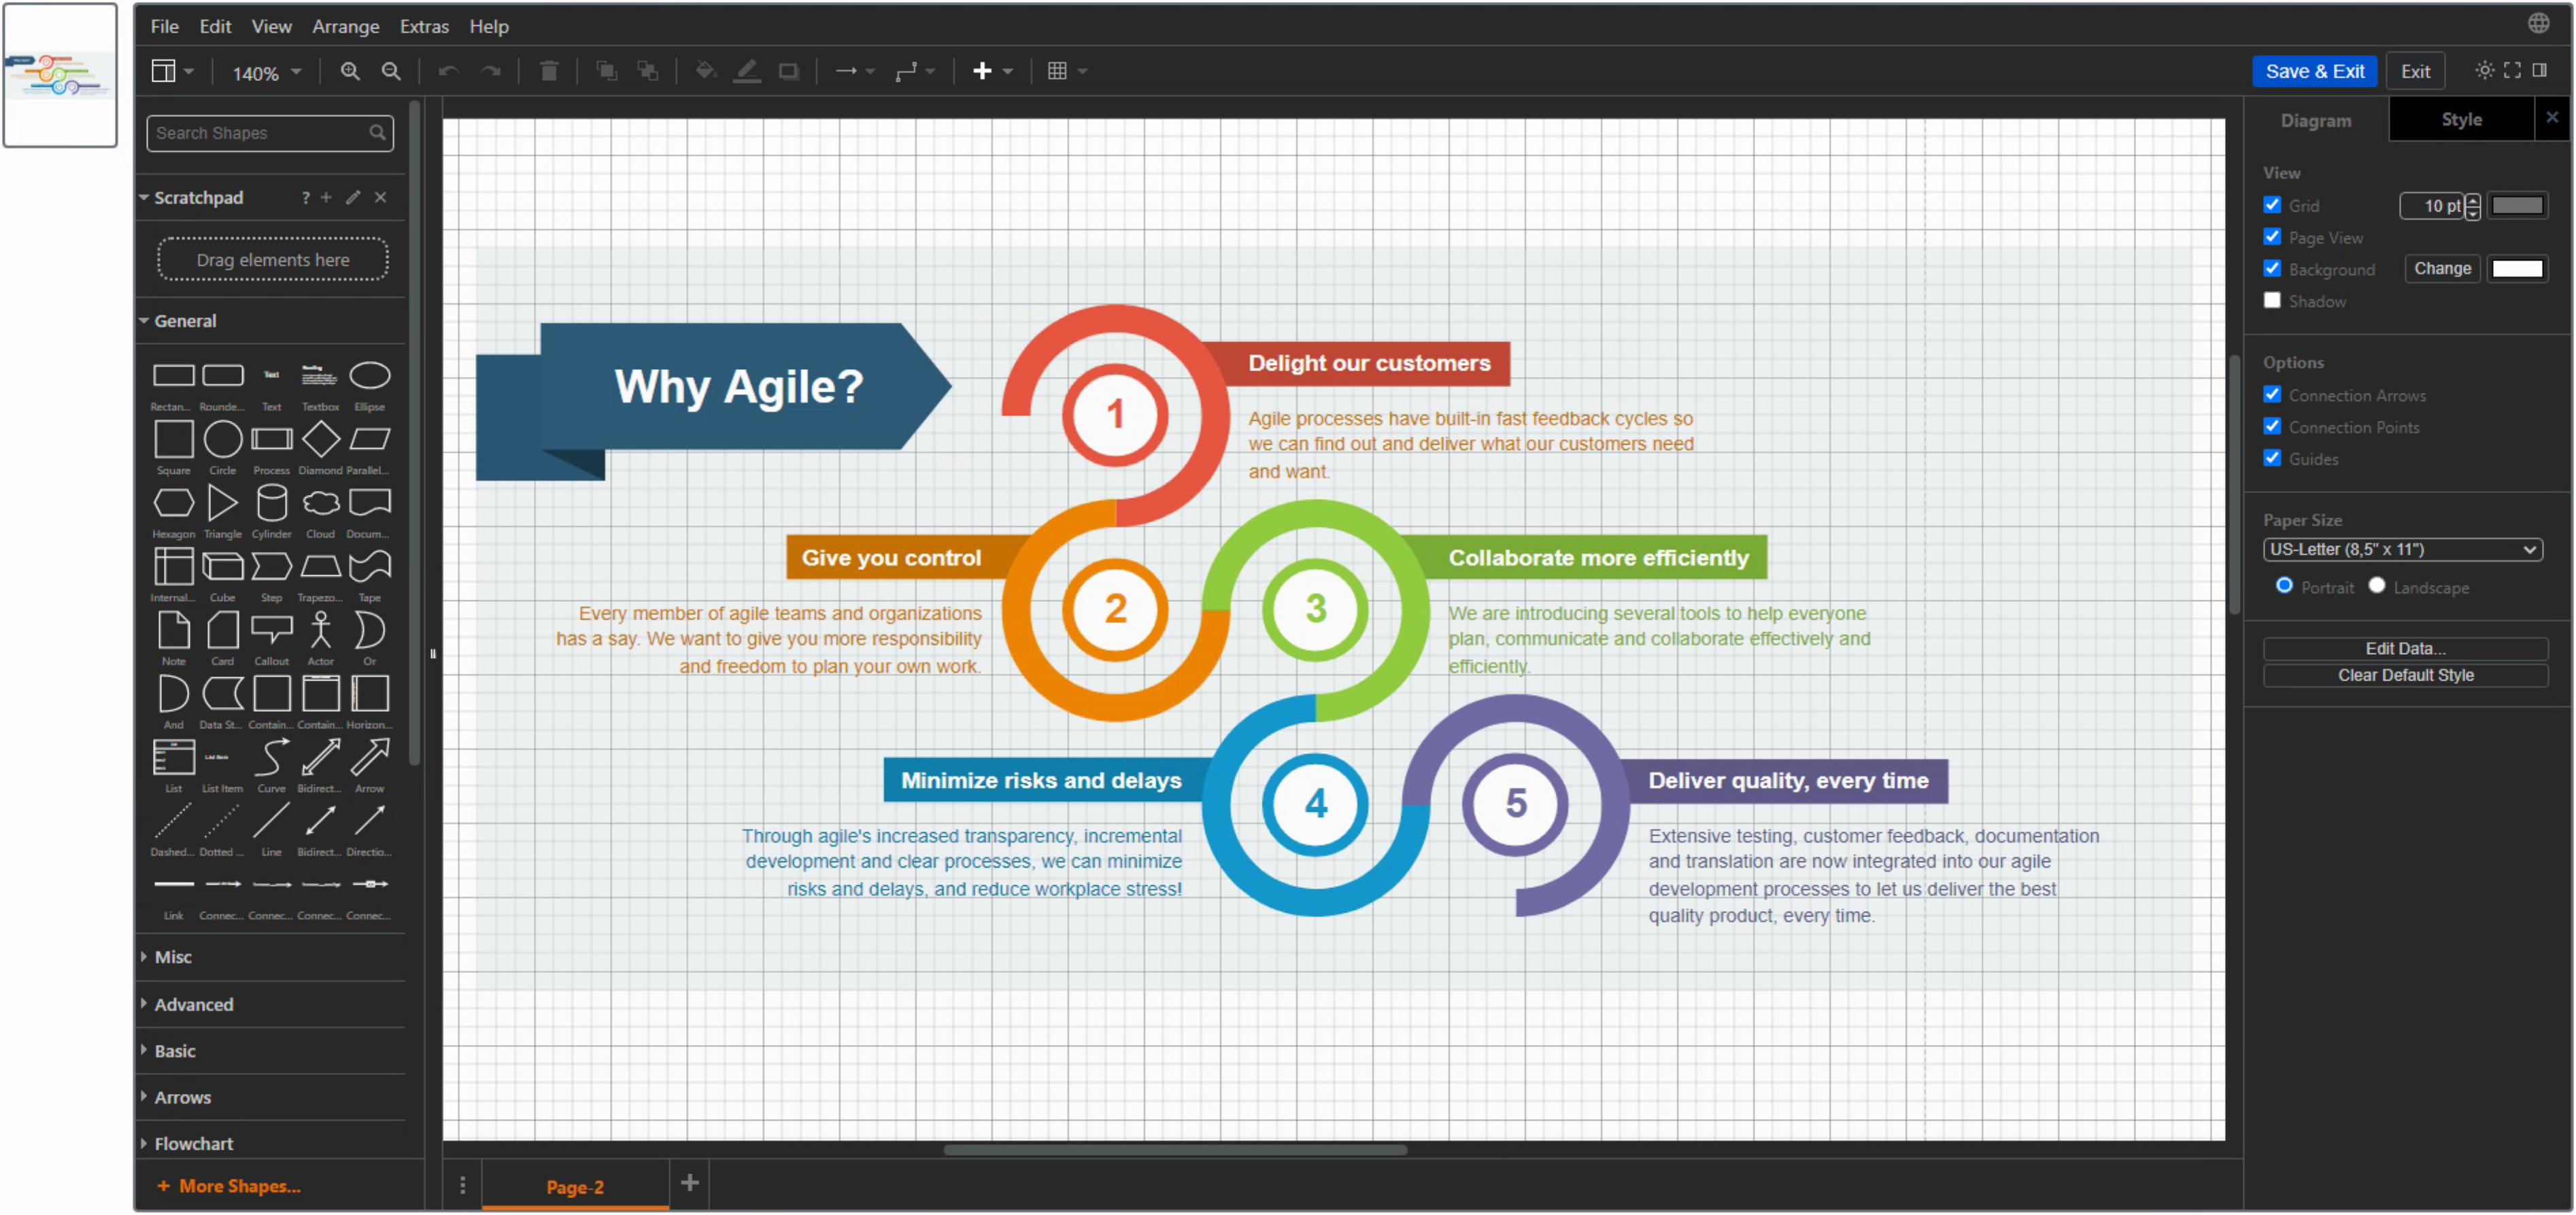
Draw.io Dark Theme, Infographic Example Diagram.
And finally, the "libraries" parameter determines whether just the built-in shape libraries are available, or
whether additional libraries can be created or loaded. We'll get to custom shape libraries in a moment, but this
option is what determines whether the menu option is available in the interface.
    var params = '/?embed=1'+
                 '&libraries=1'+
                 '&saveAndExit=1'+
                 '&noSaveBtn=1'+
                 '&proto=json';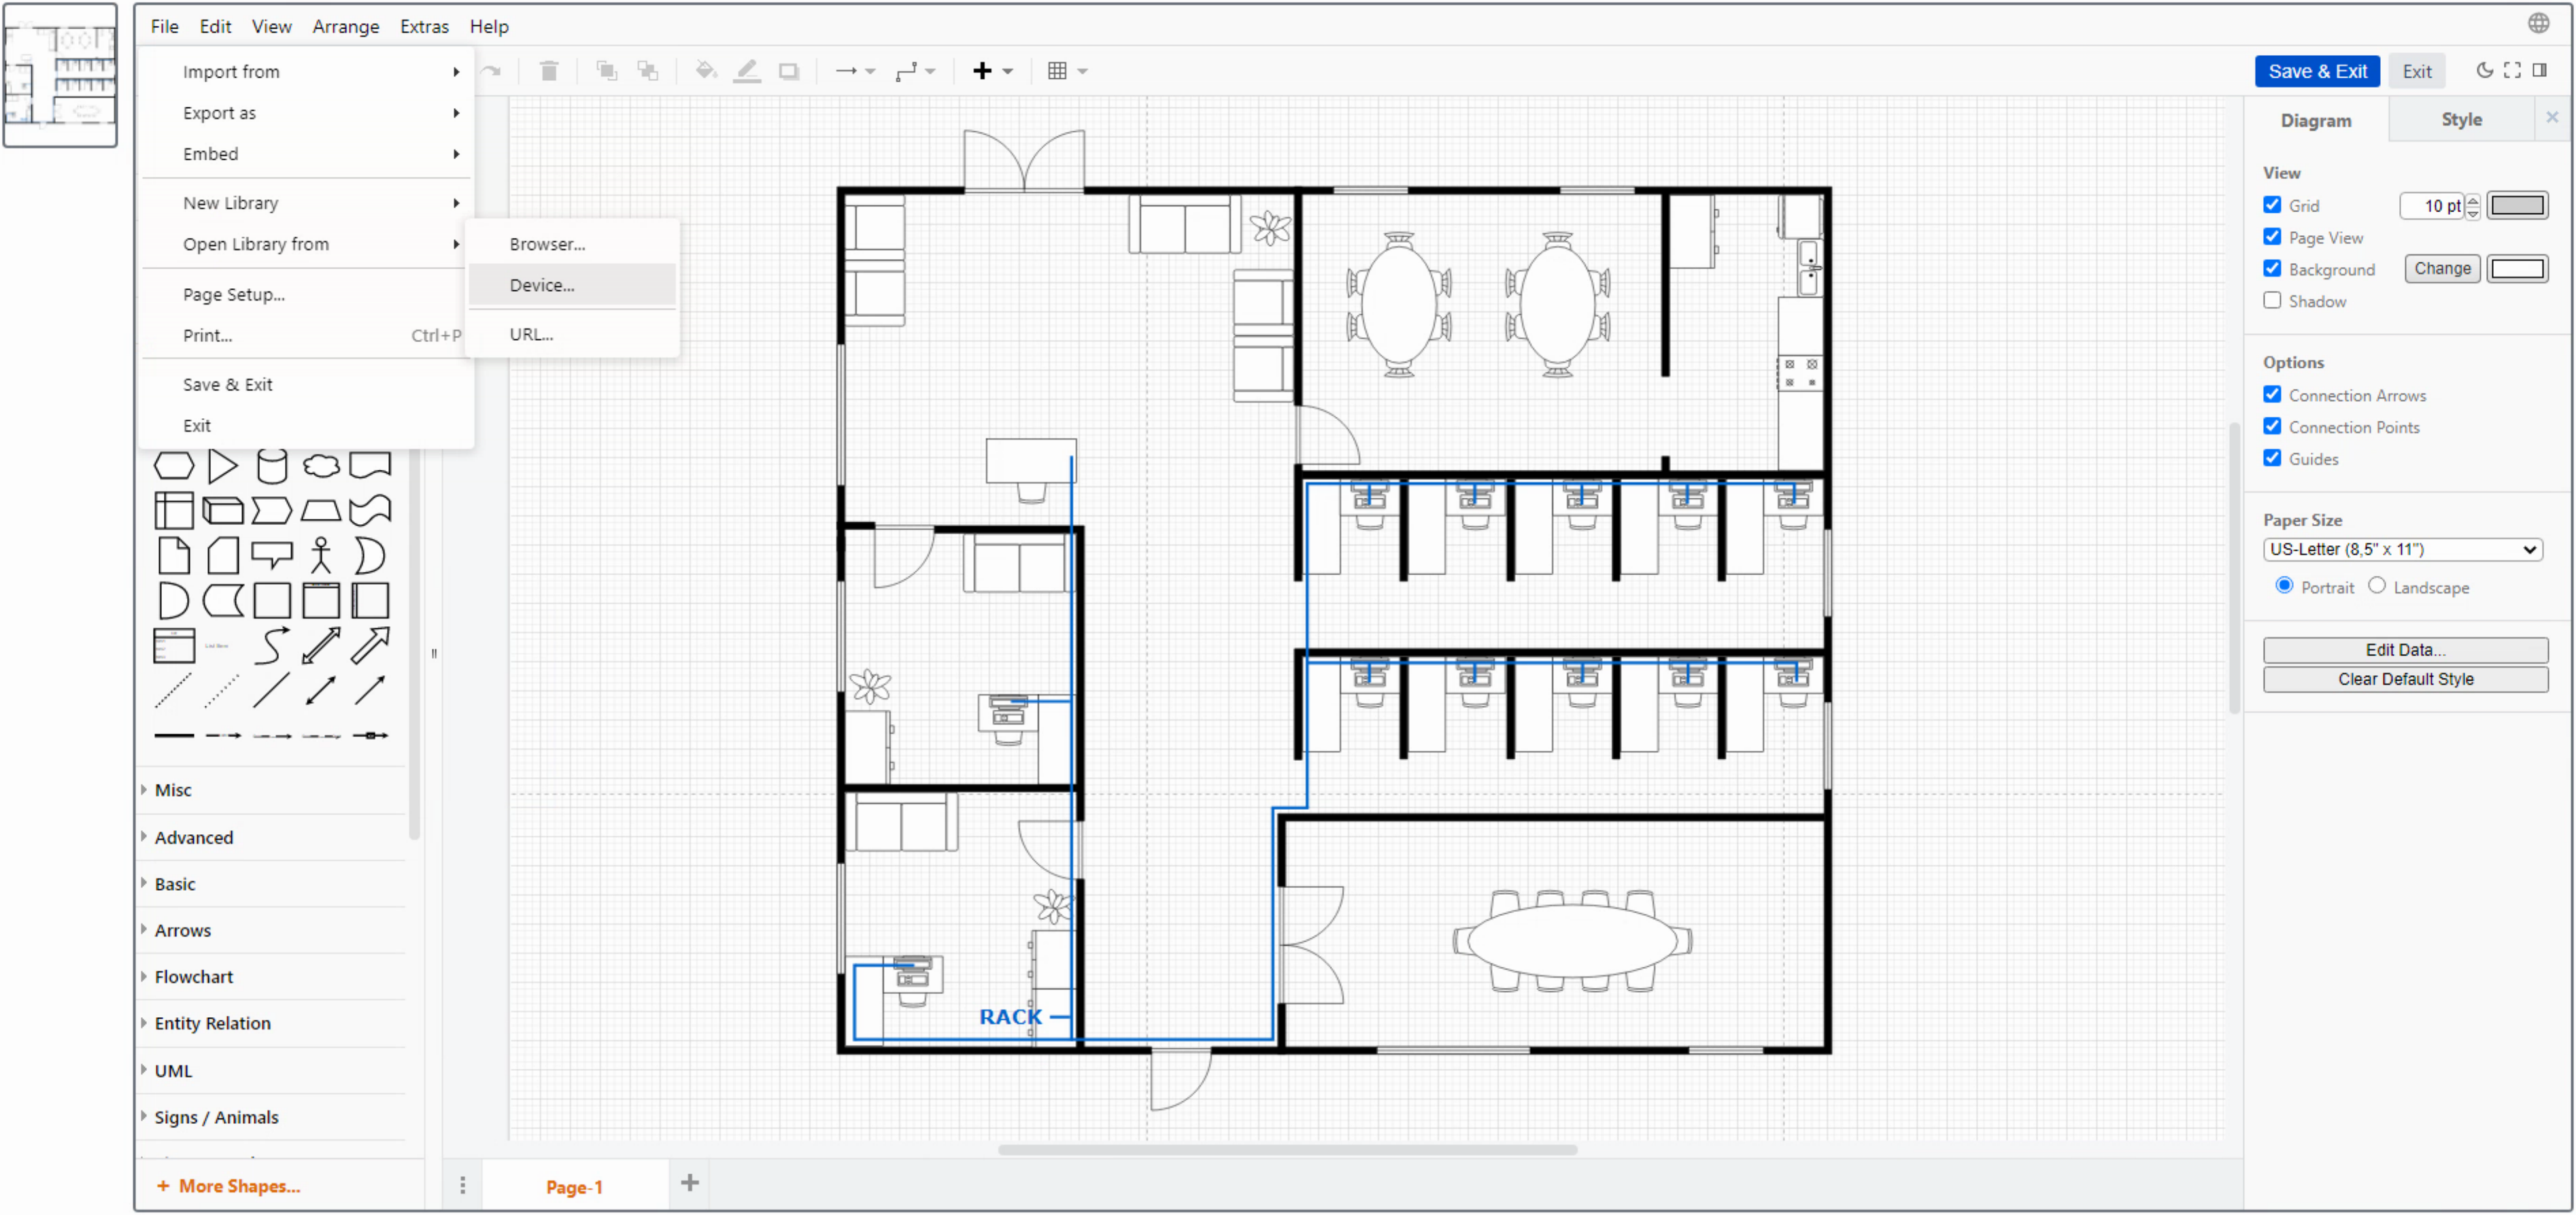
The libraries option didn't seem to appear under the Sketch theme for some reason.
Configure Options.
The options we've covered so far are passed to the <iframe> when the Draw.io web application is first loaded. But a great deal more configuration can be done using the "config" parameter, which tells Draw.io to do another round of back and forth to get the details. The list of what you can configure using this mechanism is considerably more extensive and relates more to the application's appearance and available options, like fonts and colors.
To get this working, we've got to pass the "configure" parameter, add the ability to handle the "configure" message coming in, and prepare a suitable "configure" message in response. The first part is easy, we just add "configure=1" as one of the parameters.
    var params = '/?embed=1'
                 '&configure=1'+
                 '&ui=atlas'+
                 '&libraries=1'+
                 '&saveAndExit=1'+
                 '&noSaveBtn=1'+
                 '&proto=json';
For the second part, we'll just add another "else if" clause to our receive function in anticipation of this new message coming from the Draw.io application. It is generated early, even before the "init" event is generated. And like the "init" event, everything stops until a response is sent back.
            else if (msg.event == 'configure') {
              console.log('configure event received');
            }
We'll need to pass back a set of "configure" options via JSON. Let's start with something simple, adding the
"Cairo" Google Font to the list of available fonts.
            else if (msg.event == 'configure') {
              evt.source.postMessage(JSON.stringify(
               {action: 'configure',
                config: {
                  customFonts: [
                    {"fontFamily": "Cairo", "fontUrl": "https://fonts.googleapis.com/css?family=Cairo"}
                  ]
                }
               }), '*');
            }
Now, when we add a Text object to the page, Cairo is one of the available choices. No clue why Helvetica is listed twice.
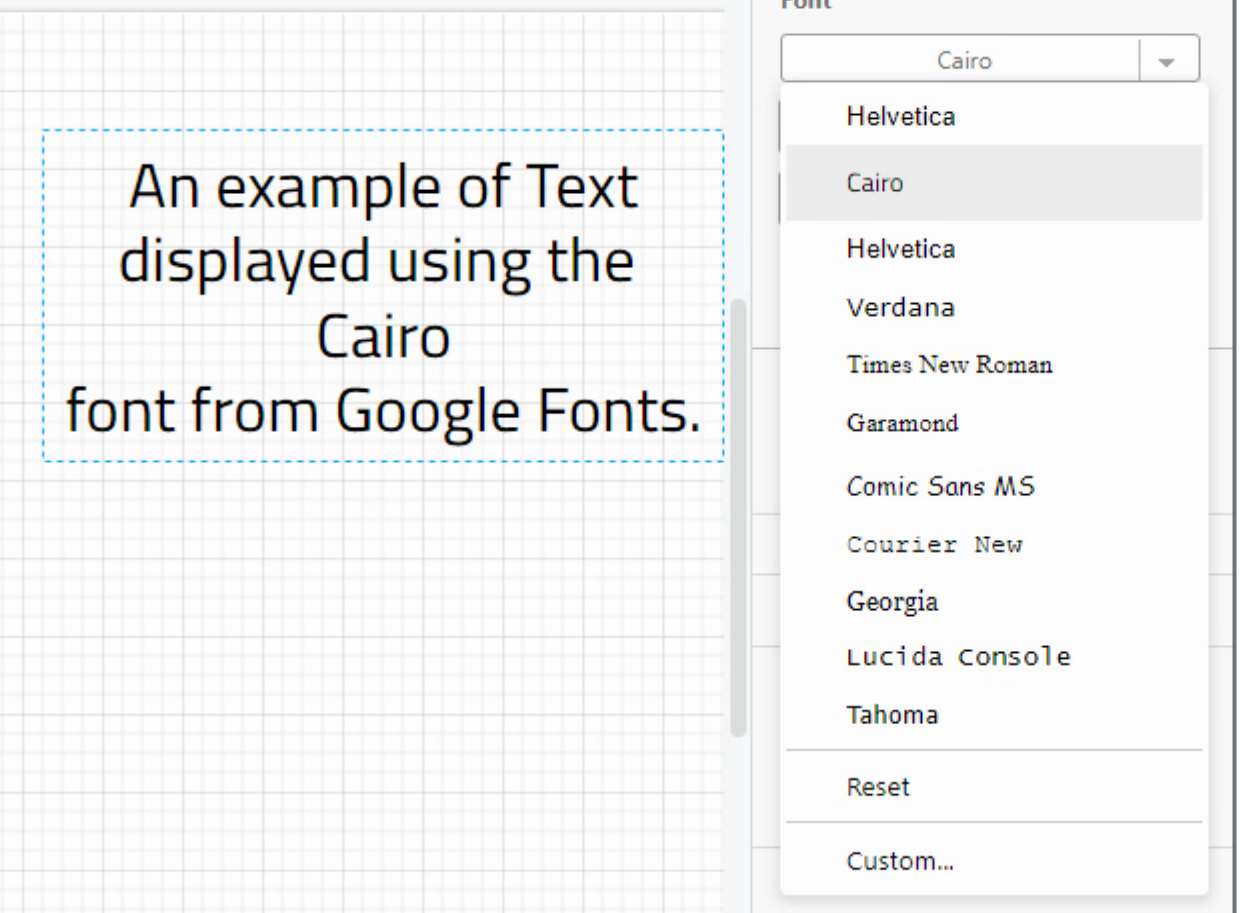
Draw.io Config Options.
Plenty more options are available here, including what colors to use, what colors are available by default, the
color schemes (combinations of vertex and edge colors, combinations of fill, stroke, and font colors), and so on.
Just add the appropriate JSON to the above block to pass them to the Draw.io application when it starts up.
Custom Libraries.
One area that might be handy to have is to be able to define a library of shapes specific to your app, and have it automatically loaded by default. If we enable libraries (see above), then creating a library is easy as selecting that option from the menu. Let's create a "Greenhouse" library and add a few shapes to it. Shapes can be ready-made shapes from another shape library, or something you create yourself, or a combination of the two.
Here we've got a "drop" shape with a blue color (freshwater) and green color (fertilizer) and a "fan" shape, as
well as a yellow rectangle where a "bug" shape has been added. These can then be dragged onto the Greenhouse
library. Once the library has whatever shapes are desired, it can then be saved (downloaded) as an XML file. This
XML file can then be shared or reloaded when editing another document.
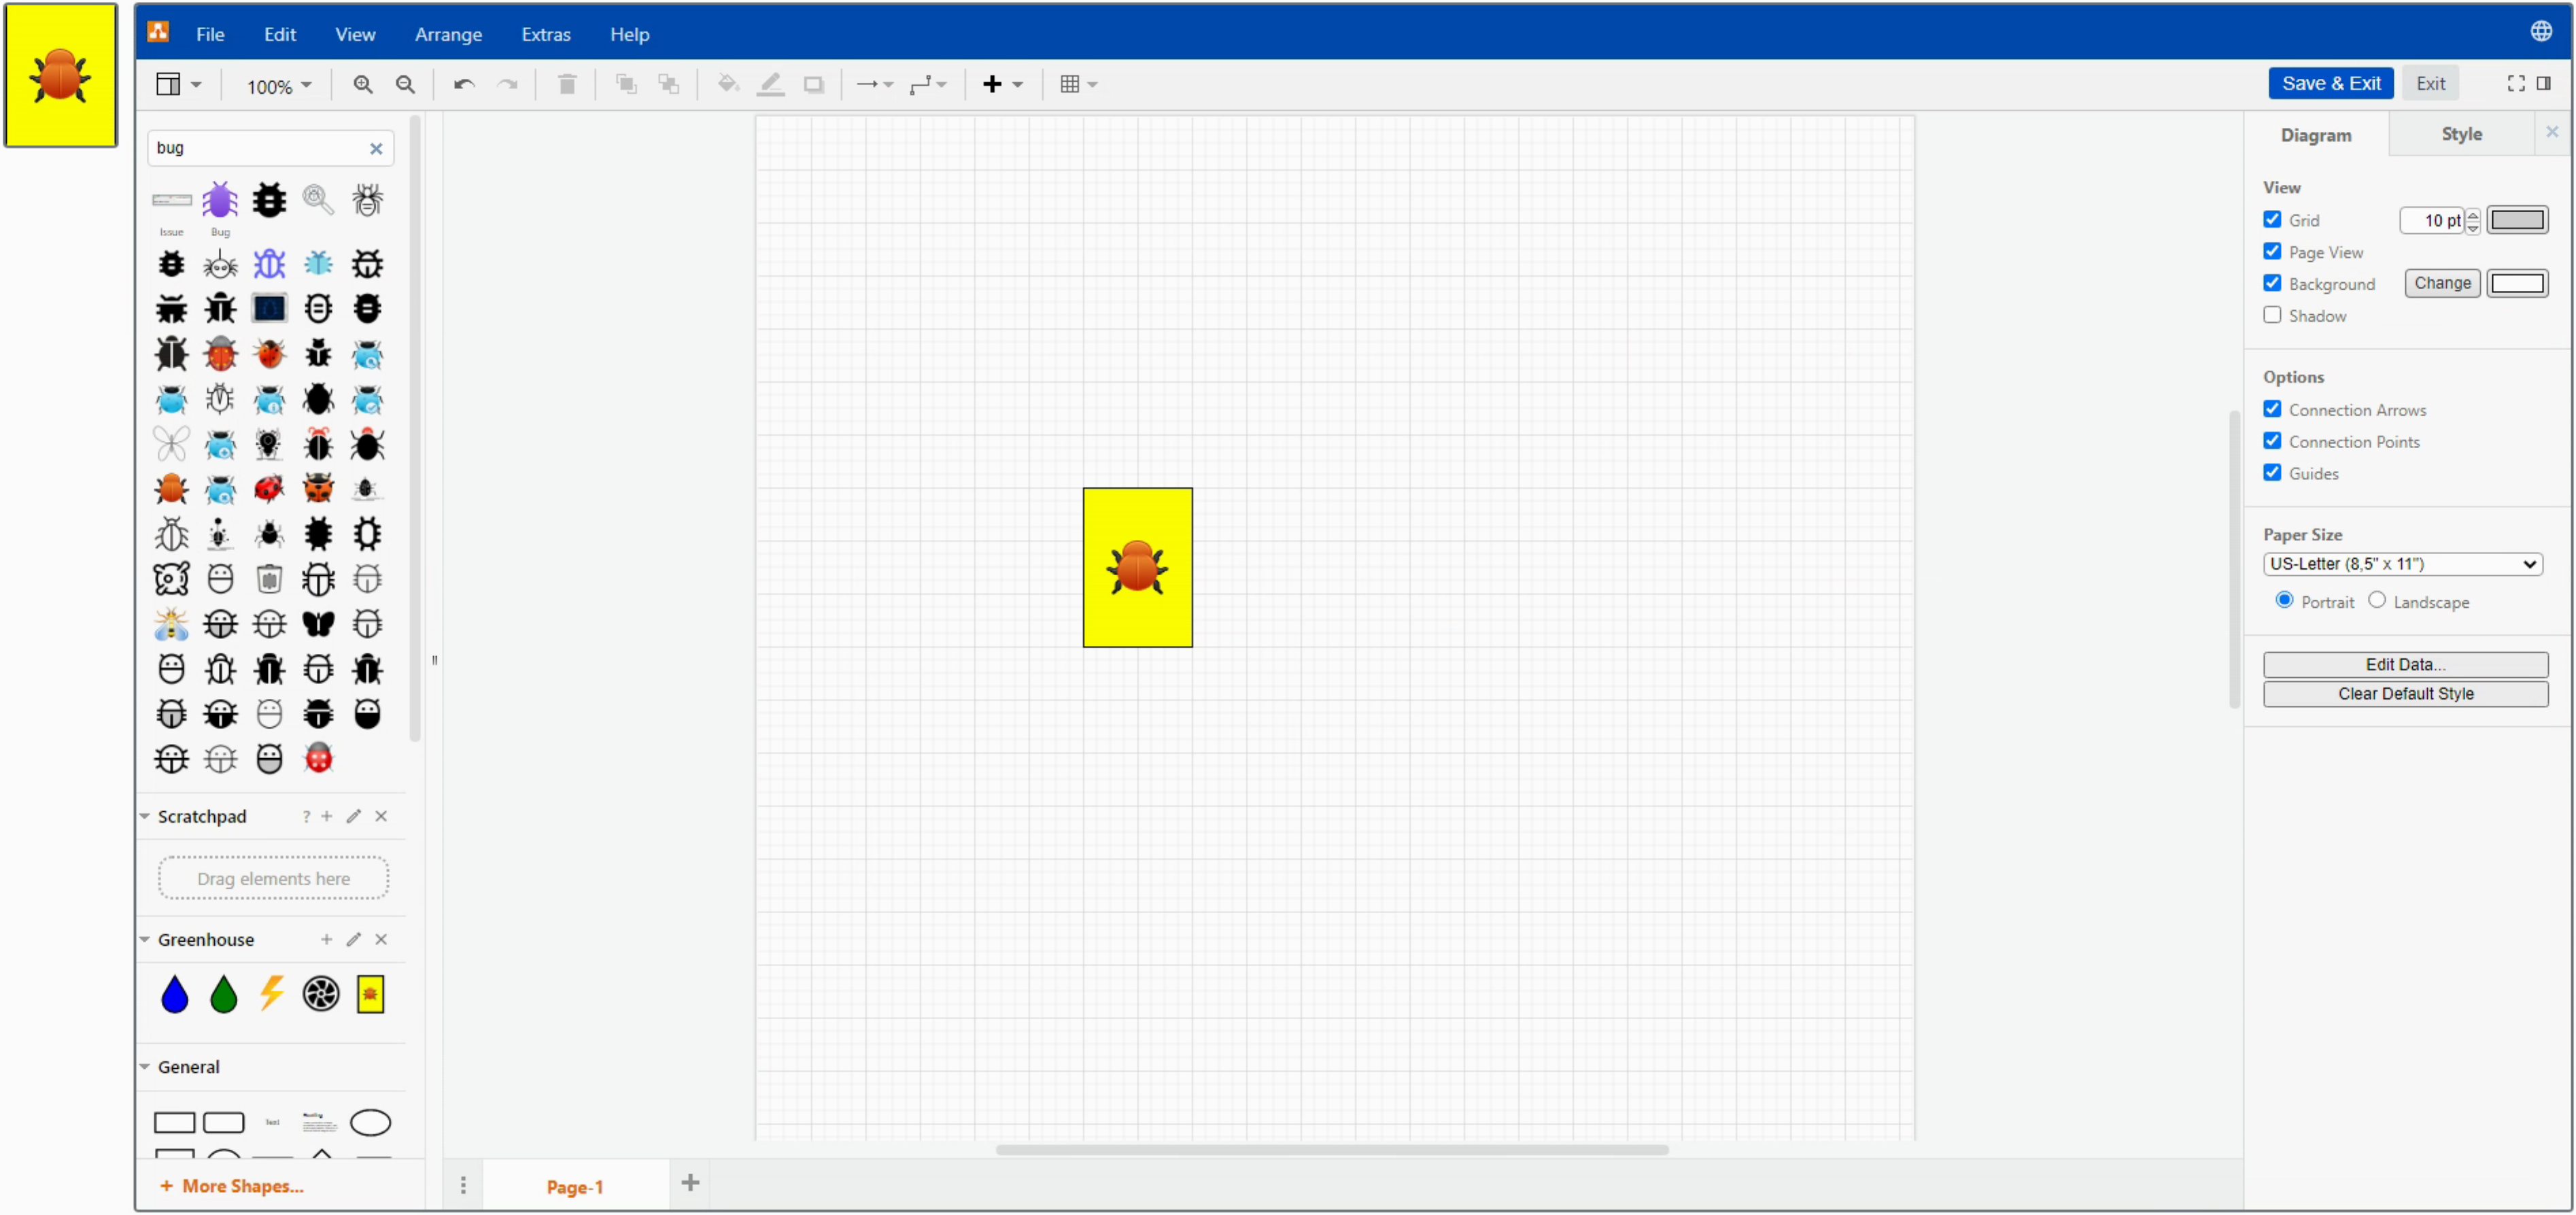
Draw.io - Creating Custom Greenhouse Shape Library.
To have this library automatically loaded each time, it can be passed as one of the initial parameters. For
example, if the library is included as part of the deployment, it can be added like this.
    var params = '/?embed=1'+
                 '&configure=1'+
                 '&ui=atlas'+
                 '&libraries=1'+
                 '&saveAndExit=1'+
                 '&noSaveBtn=1'+
                 '&clibs=U'+encodeURIComponent('https://www.myserver.com/Greenhouse.xml')+
                 '&proto=json';
In this case, the library is loaded from the host (www.myserver.com)
when the Draw.io application first starts. Alternatively, the same approach can be done by adding the library as
one of the config options.
            else if (msg.event == 'configure') {
              evt.source.postMessage(JSON.stringify(
               {action: 'configure',
                config: {
                  customFonts: [
                    {"fontFamily": "Cairo", "fontUrl": "https://fonts.googleapis.com/css?family=Cairo"}
                  ],
                  defaultCustomLibraries: ['U'+encodeURIComponent('https://www.500foods.com/Greenhouse.xml')]
                }
               }), '*');
            }
Naturally, many libraries can be added in the same way. The default libraries can
also be configured in this way, or even locked down to restrict which libraries are available in the first place.
Plugins.
There are a handful of plugins available within Draw.io to do more specialized things, and these can be permitted, or not, or enabled by default, much like how access to the libraries is controlled. Most of the plugins aren't particularly interesting, but there is one - SQL - that has some potential. By providing it with a set of SQL CREATE statements, it will create an Entity Relationship Diagram (ERD) automatically. Well, the beginnings of one anyway. The tables are created, and if you've got foreign keys defined, it may help with that as well. You're left with the potentially arduous task of connecting them together, but this may be a real timesaver. Initially at least.
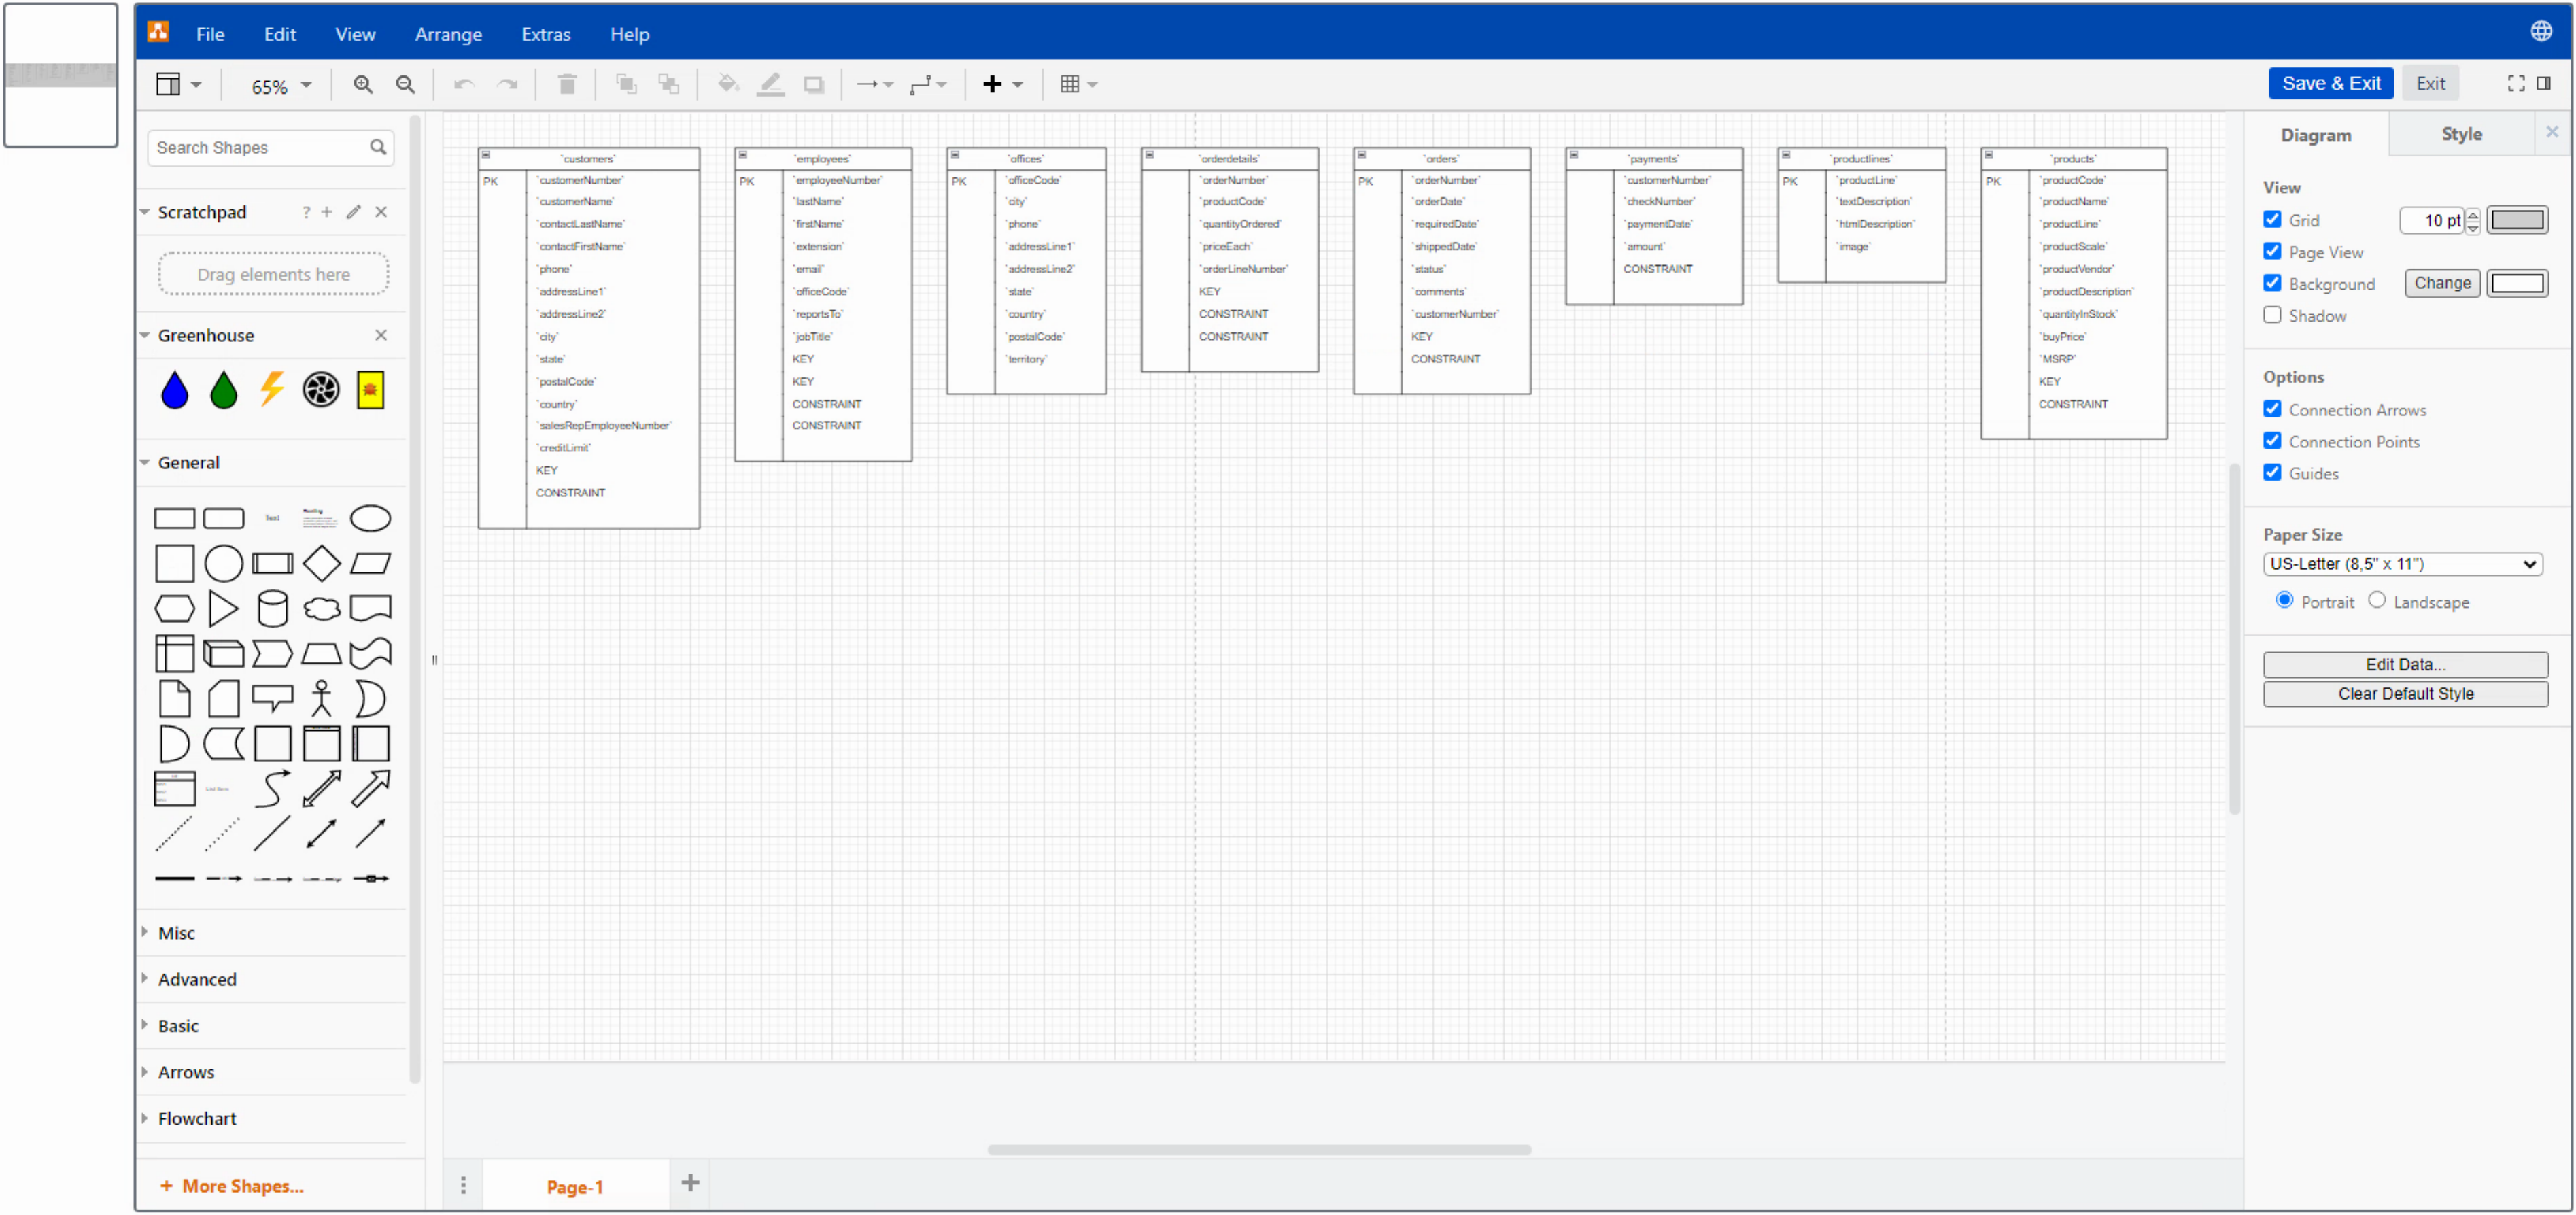
Draw.io and Creating an ERD.
To have the plugin loaded each time without prompting, it can be added to the initial parameters.
    var params = '/?embed=1'+
                 '&configure=1'+
                 '&ui=atlas'+
                 '&libraries=1'+
                 '&saveAndExit=1'+
                 '&noSaveBtn=1'+
                 '&p=sql'+
                 '&proto=json';
Other Integration Points.
While the SQL plugin is a little anemic, there are other more powerful tools available within Draw.io to do interesting things. For example, there's a whole section devoted to crafting CSV files that can automatically generate org charts, for example, or automatically flow objects for other kinds of diagrams. Various forms of interactivity are possible as well, such as being able to drill down into an org chart or a UML diagram. Details can be found here.Diagrams that are created in Draw.io can also be exported in a number of different ways, such as the usual image
formats. But they can also be exported as complex HTML snippets. Or even as an <iframe> that incorporates the
diagram and a fully-featured viewer with a link to edit the diagram, ready to be placed nearly anywhere. Even right here!
If editing the diagram content programmatically is important to your project, there are even a few options there as well. The XML that is created that represents the document is embedded in the PNG file (or SVG or PDF file) as we've covered earlier. It is also possible to get that XML data and manipulate it, and then pass it back to Draw.io to use. If you have to extract the XML from the PNG file or want to decode the XML if you retrieve it directly as one of the export options, it is usually encoded and compressed. But still accessible if needed. The updated XML (after your application has made any desired alterations) can then be passed back to the Draw.io application to display the results.
Sample project download
As with other articles, for your convenience, the sample full source is available again. You can download it here.
Summary
Overall, this approach might not be nearly as developer-friendly as FNC Blox, so if that's your primary use case, then FNC Blox would likely be a better starting point. But overall, Draw.io provides a very complete diagramming package in a way that makes it easy to embed in our TMS WEB Core projects. What do you think? Is this something you might consider using in one of your projects?Follow Andrew on 𝕏 at @WebCoreAndMore or join our 𝕏 Web Core and More Community.
Andrew Simard

This blog post has not received any comments yet.
All Blog Posts | Next Post | Previous Post