Blog
All Blog Posts | Next Post | Previous Post

 TMS FNC Chart: update with Types, Appearance and CSV Loading
Thursday, June 2, 2022
Version 2.0 of the TMS FNC Chart is available. This major release brings a lot of new features.
Most of them are related to quickly get the chart that you want with just a couple lines of code.
An overview of the features that were implemented:
- Chart type specific sub classes
- Appearance: with the color scheme and global font
- Load From CSV
- Load From Array
- Load From JSON
- Database Adapter
- Grid Adapter
In this blogpost we will elaborate on the first three features mentioned in the list. The others will be addressed in a follow-up blogpost.
Holger has created a great video, where he combines some of the new features in a simple application.
With just one line of code, he loads a CSV file in a bar chart.
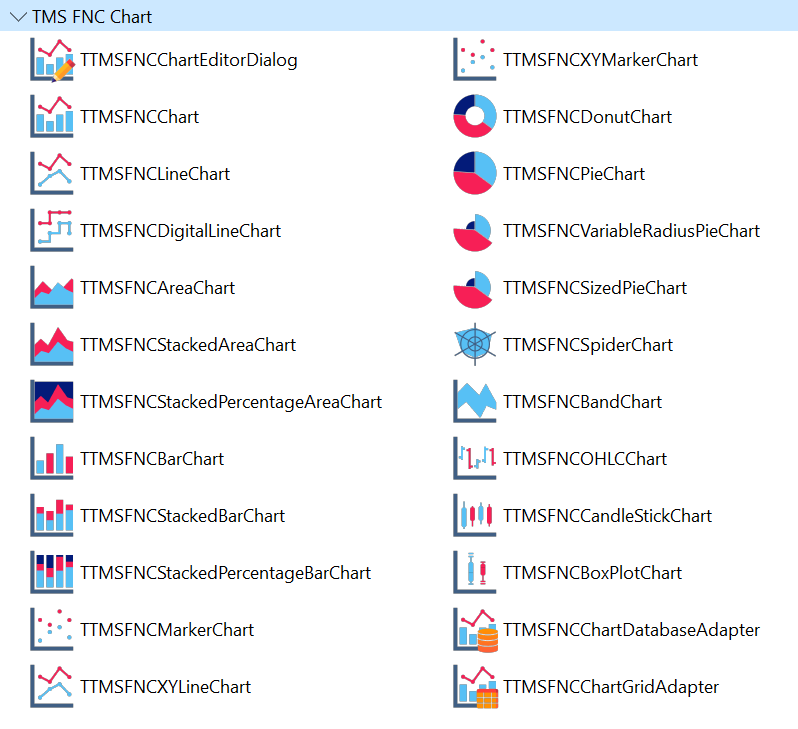
Chart Type Specific Sub Classes
A lot of new components were added to the package, these are all instances of the TTMSFNCChart each with a different chart type set as default. This way you can immediately start working with a bar chart (or any other) without the need to change the type of the series.
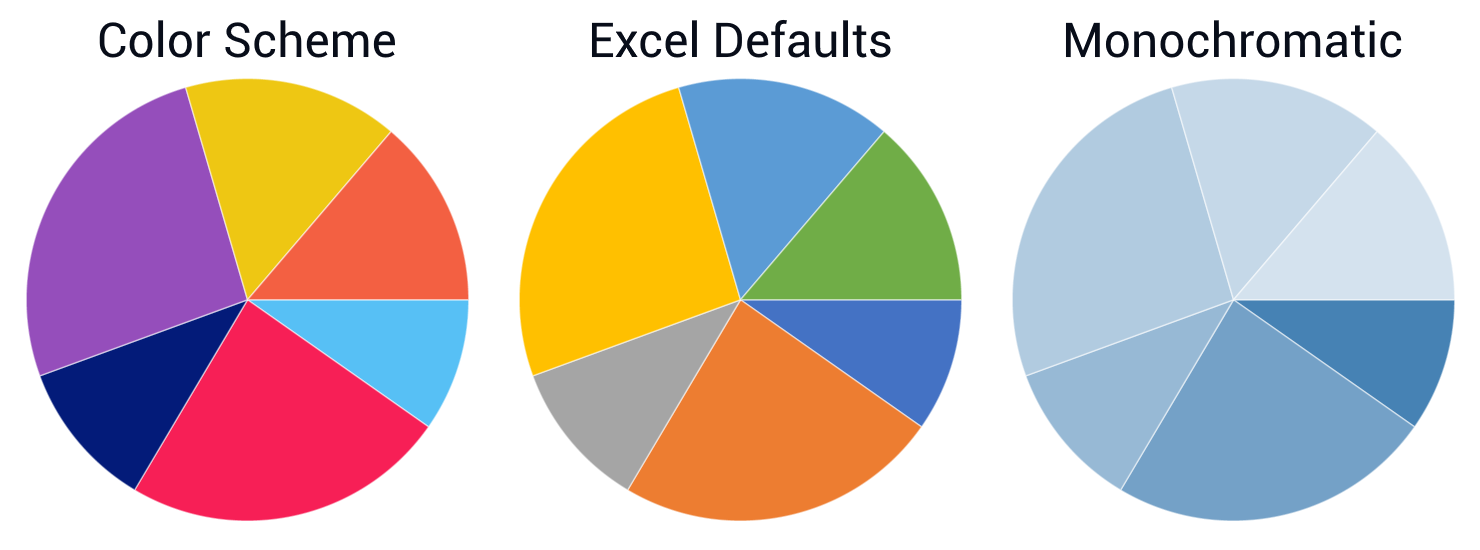
Appearance
You can easily set the overall look of the chart with the new Appearance property. This property currently exist of two larger parts.
The color scheme can be set with a list of predefined colors, you can use the default Excel colors or you can get different shades of a selected color.
The other one is the GlobalFont. This property gives you the ability to set all the fonts of the chart with one setting.
You can change the size, font name, color and/or style and you can keep the proportions of all the fonts and just scale them a little bigger or smaller.
Load From CSV
Different ways were added to load data from a file, stream or text. And those will be further explained in some upcoming blogposts.
But now we will focus on the LoadFromCSV method.
This method will take the indices of the different columns that you want to use. For some parameters these are arrays of integer, that way you can create multiple series in one call.
Another new property in the chart is the DefaultLoadOptions, with this property you can choose how series will be added/updated when using some kind of data loading. If you want to deviate from the defaults for one csv you can add an instance of the TTMSFNCChartLoadOptions that you've created to the parameters of the LoadFromCSV call.
This was added because we want to be as flexible as possible. And in that regard we've made three different ways to add different types of data.
First you have the short method:
TMSFNCChart.LoadFromCSVData(myFile.csv, [1,2], -1, 0);
//Parameter 1: my file, stream or text variable.
//Parameter 2: Array of Integer that are mapped on the y-values. A Series will be created for each value.
//Parameter 3: The x-values that you can use, as this is -1 they are skipped while loading.
//Parameter 4: The index for the column that uses the labels shown on the x-axis. If not set this is -1 and skipped.
A more detailed procedure that takes the second or variable values:
TMSFNCChart.LoadFromCSVDataEx(myCSVStream, myLoadOptions, [1,3], -1, 0, nil, [2,4]);
//Parameter 1: my file, stream or text variable.
//Parameter 2: Optional load options, if not define the DefaultLoadOptions are used.
//Parameter 6: Optional, the ysecond-values that are used in a band chart.
//Parameter 7: Optional, the yvariable-values that are used in a sized pie chart for example.
For the use of multi-point data there is a specific method:
TMSFNCChart.LoadFromCSVDataEx(myCSVStringList, 0, 1, 3, 4, 2);
//Parameter 1: my file, stream or text variable.
//Parameter 2: The column index that has the high values for the points.
//Parameter 3: The column index that has the low values for the points.
//Parameter 4: The column index that has the open values for the points.
//Parameter 5: The column index that has the close values for the points.
//Parameter 6: Optional, The column index for the median values.
//This method can also take the x-values and x-labels as the 7th and 8th parameter.
To see a working example , you can check the demos, the video from Holger or the project from a previous blogpost.
Online Documentation
With this update we are starting the transfer to online documentation for our TMS FNC products.
This will make it easier for us to keep the document up-to-date and we now have the ability to link different sections, to make it easier for you to search through the documentation.
For more information on the TMS FNC Chart product, you can visit the products page.
Gjalt Vanhouwaert

This blog post has received 2 comments.
 2. Tuesday, June 7, 2022 at 1:46:35 PM
We were not immediately aware of this problem.
2. Tuesday, June 7, 2022 at 1:46:35 PM
We were not immediately aware of this problem.We have changed this and it will be available in the following update of TMS FNC Chart.
Gjalt Vanhouwaert
All Blog Posts | Next Post | Previous Post
Sox Daniel