Blog
All Blog Posts | Next Post | Previous Post

 Interact with your chart data in Delphi
Wednesday, May 4, 2022
Last week we did a blog on visualizing your own data structure, which showed the capabilities of virtual data, and the little code required to get up and running. Today's blog is demonstrating how to interact with the chart. When the data is loaded, how do we zoom in, out? How can we get more details about a specific point in the data?
Panning
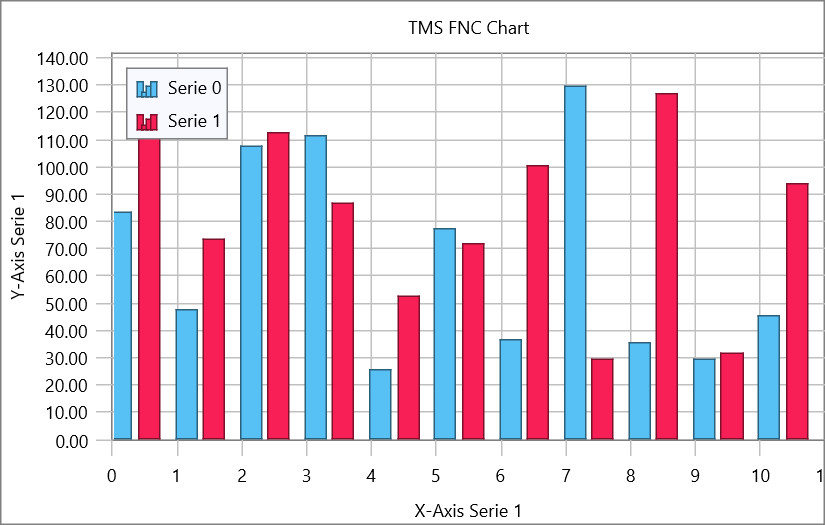
Panning is enabled by default, you can pan left to right on the X-Axis. To enable/disable panning, you can use the InteractionOptions.Panning property. Panning is done by moving the finger/mouse from right to left, or left to right. By default, the chart is showing the full range of points, starting at point 1.
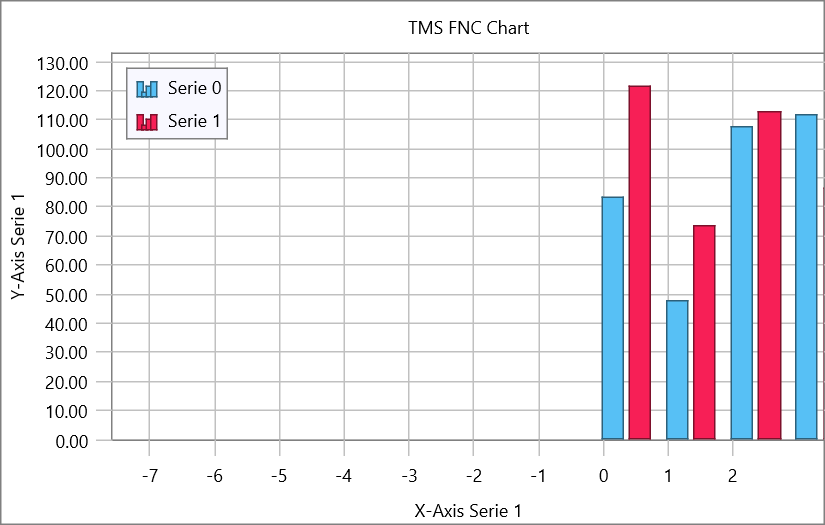
Dragging from left to right will show points before the zero valuepoint on the chart
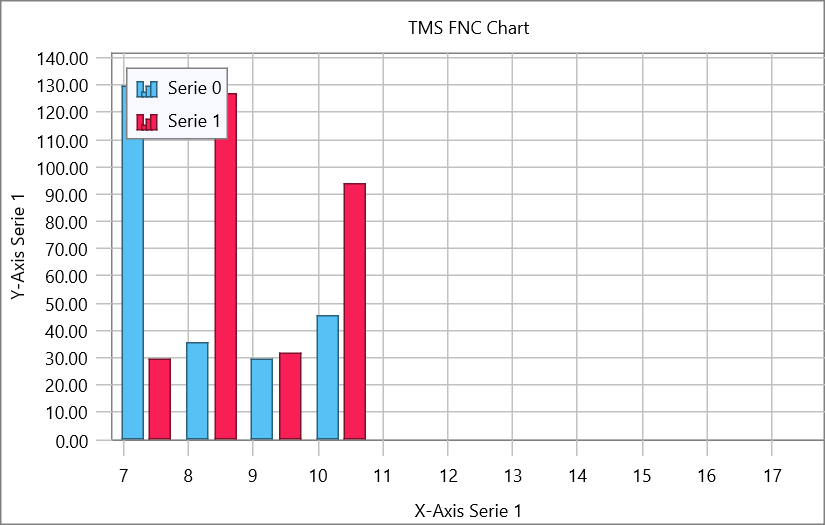
Dragging from right to left will show points after the last visible
The chart can be reset by using the following code
TMSFNCChart1.BeginUpdate;
for I := 0 to TMSFNCChart1.Series.Count - 1 do
  TMSFNCChart1.Series[I].AutoXRange := arEnabled;
TMSFNCChart1.EndUpdate;
Zooming
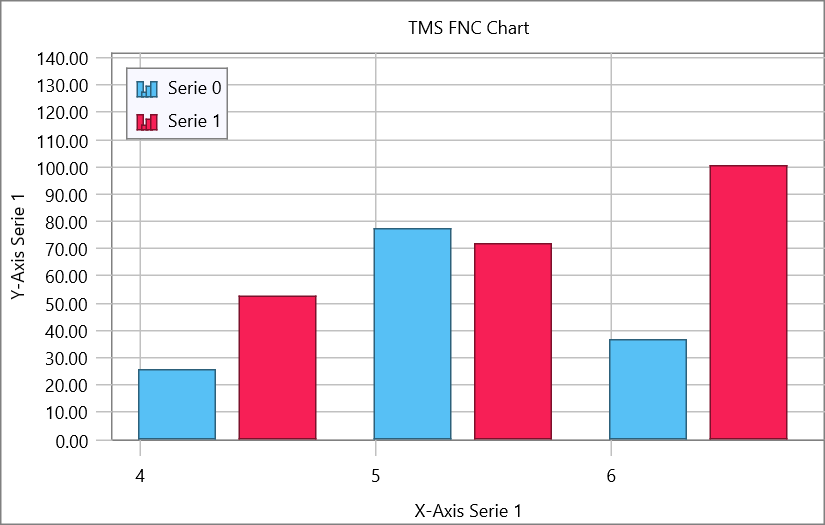
Zooming in / out is also enabled by default, on the x-range, which means that you can zoom/scale horizontally. This can be done by holding the CTRL key on the keyboard, dragging the mouse / finger left & right or by doing a pinch gesture on iOS/Android. Below are 2 screenshots of the chart in action whilst zooming in and out
The chart can be reset in the same way as with panning. The property to support scale interaction is located under InteractionOptions.ScaleMode which can be set to smHorizontal (default), smVertical (y-values scaling) or smNone.
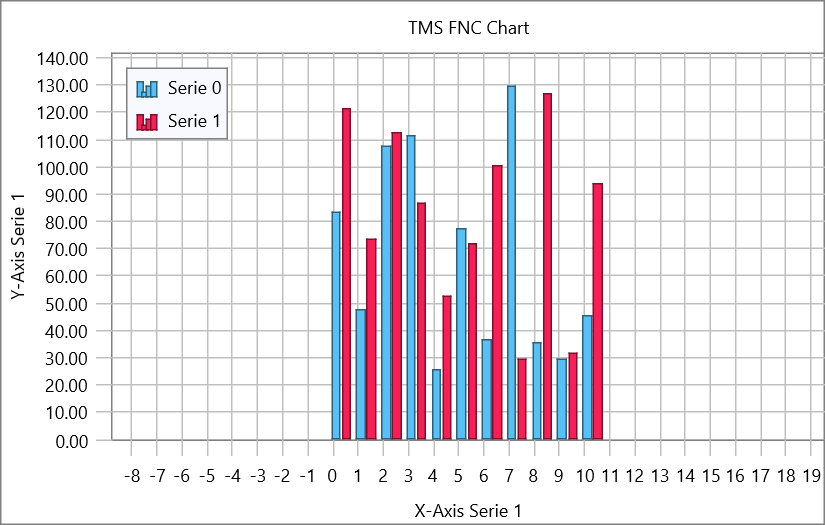
Point Detection
The chart exposes a series of events that are triggered when clicking on a point, bar, slice or an item in the legend. For this sample, we want to click on a bar, visualize the value and change the color. The code to do this is shown below.
procedure TForm1.TMSFNCBarChart1SerieBarClick(Sender: TObject;
  APoint: TTMSFNCChartPoint);
begin
  APoint.Color := gcOrange;
  ShowMessage('The point clicked has a value of ' + APoint.YValue.ToString);
end;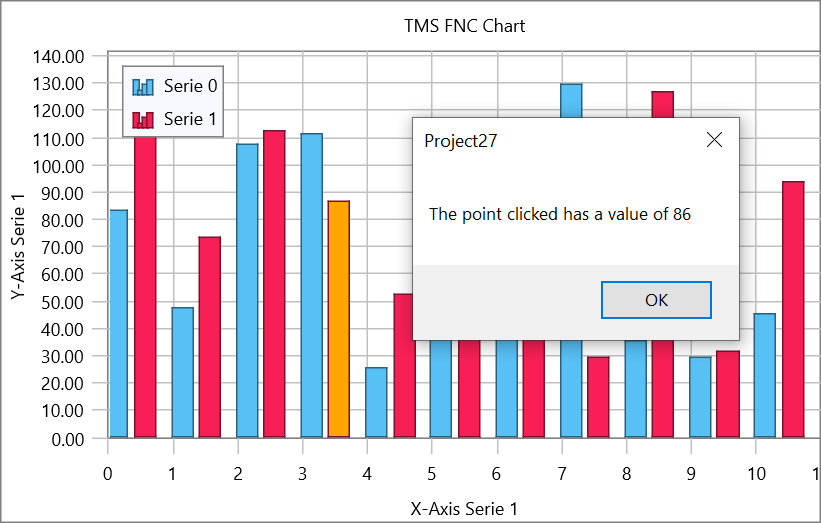
v2.0
Our team is working hard on the next version which will include a significant amount of new features and improvements related to data import, look & feel and out of the box experience. Stay tuned for more! Want to explore the capabilities of TMS FNC Chart, go ahead and download it from our product page.
Pieter Scheldeman

This blog post has received 3 comments.
 2. Wednesday, May 4, 2022 at 2:04:24 PM
Thank you for the comment! We are currently working on v2.0 and will investigate the possibilities of more natural interaction experience.
2. Wednesday, May 4, 2022 at 2:04:24 PM
Thank you for the comment! We are currently working on v2.0 and will investigate the possibilities of more natural interaction experience.
Pieter Scheldeman
3. Thursday, May 5, 2022 at 7:29:34 AM
Is there an example of easily adding functions?Say
1.Bollinger Bands- that draws on the same axis as the OHLC chart.
2. MACD - that draws on a separate Axis.
Both of the above needs to support adding/changing the last candle in the source series and then have the function "partially" recalc only using the required "lookback" values that impacts the function result.
JP Pienaar
All Blog Posts | Next Post | Previous Post
Thanks
Dan
Sox Daniel