Blog
All Blog Posts | Next Post | Previous Post

 Adding the 3rd dimension to TMS WEB Core
Thursday, March 7, 2019
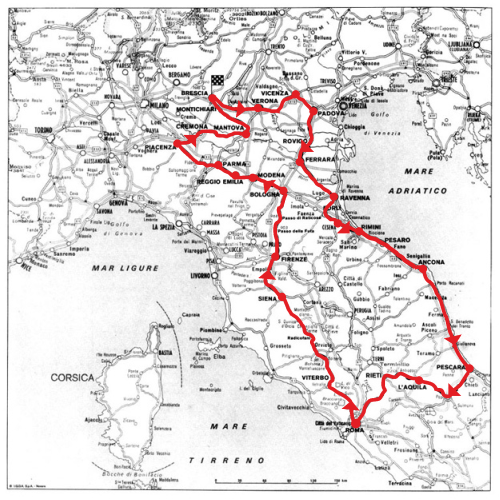
Our team is working hard on the next major release of TMS WEB Core. This will be TMS WEB Core v1.2 Padua. Padua is the next city after Brescia (1.0) and Verona (1.1) on our Mille Miglia race track.
We have shown already a preview of the support for Electron based cross platform desktop apps that will come out of the box with TMS WEB Core v1.2. The new version 1.2 will also come with numerous Object Pascal to JavaScript transpiler enhancements (Pas2JS v1.4) with most importantly the support for anonymous methods. There is a lot more coming that we will unveil in the coming weeks!
With this blog, we wanted to take you to the 3rd dimension that will be added to TMS WEB Core in v1.2, that is the support for 3D graphics based on the amazing WebGL / ThreeJS technology. Thanks to this technology, rendering 3D scenes is fluid and fast right out of any modern browser. This means Chrome, FireFox, Opera, Safari on desktop and on mobile devices.
The WebGL / ThreeJS technology is powerful but it can be quite complex and daunting. Here comes the TMS WEB Core framework with easy usable classes for taking advantage of this technology.
In the upcoming TMS WEB Core this will be exposed via 3 UI controls:
- TWebThreeJSPaintBox
- TWebThreeJSChart
- TWebThreeJSMathChart
Custom 3D scenes with TWebThreeJSPaintBox
The TWebThreeJSPaintBox is a simple 3D scene renderer. Where in a regular 2D PaintBox you do the drawing with lines, rectangles, ... here you can add 3D objects like cube, sphere, cylinder, text, lines, shapes, 3D models ...
Adding a red sphere becomes as simple as:
var
  anObject: TThreeJsObject3D;

begin
  anObject := threeJsPaintBox.addSphere(2, clRed, 10, 8, 4);
  anObject.name := 'sphere1';
  threeJsPaintBox.Invalidate;
end;
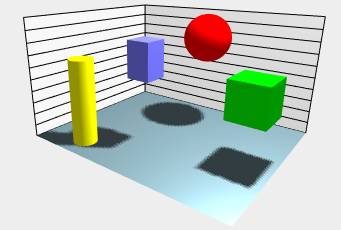
As such, the TWebThreeJSPaintBox allows to create any custom 3D scene easily using the ObjectPascal language.
3D business charts with TWebThreeJSChart
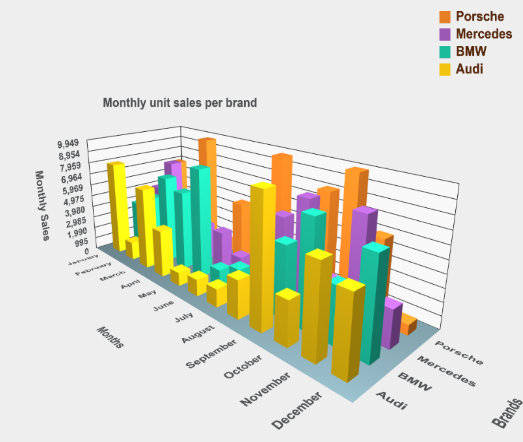
The next 3D control is the TWebThreeJSChart. This is a 3D chart with 3 axes. It allows to add series with their 3D values, select the chart type (bar, cone, line, area, cylinder, scatter) and the TWebThreeJSChart will do all that is necessary to setup the 3D scene to render the chart.
We have created a small & quick demo to demonstrate the power. This 3D chart visualizes the virtual sales results of Germany's leading car manufacturers: Audi, BMW, Mercedes, Porsche. To make the data editable to let users play with the chart, it is displayed in a TWebStringGrid. It shows 4 columns for the sales results for the 4 car manufacturers and 12 months of the year. To configure the 3D chart from the results in the TWebStringGrid, the following code is used:
procedure TForm2.LoadSampleSeries;
var
  aSeries: TThreeJsChartSeries;
  brands: TJSArray;
  months: TJSArray;
  values: TJSArray;
  i,j,v: integer;
begin
  brands := TJSArray.new;
  months := TJSArray.new;

  // create the X-axis for the series filled with the car brand names from the string row header
  for i := WebStringGrid1.ColCount - 1 downto 1 do
    brands.push(WebStringGrid1.Cells[i,0]);

  // create the Y-axis for the series filled with the month names
  for i := 1 to WebStringGrid1.RowCount - 1 do
    months.push(WebStringGrid1.Cells[0,i]);

  // create the series in the 3D chart
  aSeries := TThreeJsChartSeries.Create(brands, months);

  // loop through the normal grid cells to pick the sales values and add these to the series
  for i := WebStringGrid1.ColCount - 1 downto 1 do
  begin
    values := TJSArray.new;
    for j := 1 to WebStringGrid1.RowCount - 1 do
    begin
      v := StrToInt(WebStringGrid1.Cells[i,j]);
      values.push(v);
    end;
    aSeries.addLegendRow(WebStringGrid1.Cells[i,0], values);
  end;

  // set the general 3D chart properties
  aSeries.AutoMarkValueAxis := true;
  aSeries.valueFormatFloat := '#,##0';
  aSeries.valueAxisFormatFloat := ''; //use the above
  aSeries.Title := 'Monthly unit sales per brand';
  aSeries.ValueAxisTitle := 'Monthly Sales';
  aSeries.LegendAxisTitle := 'Brands';
  aSeries.CategoryAxisTitle := 'Months';
  threeJsChart.Series := aSeries;
end;The code results in the following 3D chart or you can play with it directly from your browser.
Mathematical surfaces with TWebThreeJsMathChart
Finally, the last 3D control is the TWebThreeJsMathChart that is specialized in mathematical surface rendering, both with wireframe and solid surfaces.
TWebThreeJsMathChart is based on a TThreeJsMathChartSeries that is set for the 3D chart and this TThreeJsMathChartSeries implements a callback function that will query the mathematical formula calculation. The setup for the math chart and the X and Y range wherein the result needs to be calculated is set via:
begin
  aSeries := TThreeJsMathChartSeries.Create;
  aSeries.addParametricSurface(-10, +10, -10, +10, resolution, @surfaceCallBack);

  aSeries.Title := '3D Surface';
  aSeries.ZAxisTitle := 'Values';
  aSeries.YAxisTitle := 'Y-axis';
  aSeries.XAxisTitle := 'X-axis';

  threeJSMathChart.Series := aSeries;
end;
As we demonstrate a number of different mathematical functions to visualize in the demo, the callback function is implemented as:
function TForm2.surfaceCallBack(x, y: double): double;
begin
  // the function is selected via the combobox cbSeries
  case cbSeries.ItemIndex of
    1: Result := abs(x-y);
    2: Result := -x*x - y*y + 6;
    3: Result := sin(x)*x+cos(y)*y;
    4: Result := 2 * sqrt(x*x/3 + y*y/8);
    5: Result := sqrt(abs(1.5 * (x*x/3 - y*y/4) - 6));
    6: Result := 8 * (sin(x) + cos(y));
  else
    Result := x*x + y*y;
  end;
end;
It's really nothing more than this before you can start drooling over the wonderful world of 3D mathematical functions.
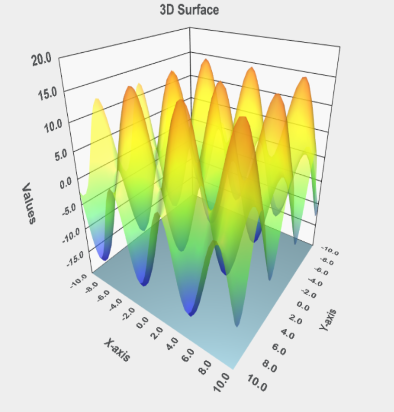
You can see it live from your own browser here.
Get started
Meanwhile, you can go ahead and explore the new & exciting territories of web client development that become available for Delphi developers with TMS WEB Core! You can download the trial version that is generally available, go ahead with the standalone version you purchased or with TMS WEB Core and additional tools that are all included in TMS ALL-ACCESS. Our team looks forward to all your comments, feedback, feature-requests to help steering the development of TMS WEB Core to the next stages!
Bruno Fierens

This blog post has received 2 comments.

 2. Wednesday, March 13, 2019 at 12:19:03 PM
Hi Marc,
2. Wednesday, March 13, 2019 at 12:19:03 PM
Hi Marc,I''m not sure I fully understand what you are hinting at, if it is at HTML/JS level or native OS level for example. Maybe we can follow-up in private email conversation?
Bruno Fierens
All Blog Posts | Next Post | Previous Post
Marc Van Broeck