Blog
All Blog Posts | Next Post | Previous Post

 TMS RADical WEB, debugging your code
Thursday, February 22, 2018
Given TMS WEB Core is based on a Pascal to Javascript compiler with the Javascript code running in the browser, there is not a direct way to debug the code from the Delphi IDE. From the IDE, the Javascript code is generated and the browser is launched with the HTML page URL. After launching the browser, there is no further interaction between the IDE and the browser. Of course, since modern browsers come with a Javascript debugger integrated, you can debug the web applications this way directly from the browser. Of course, debugging this way means you need to need to be familiar with Javascript and figure out how the Javascript you step through corresponds to the Pascal code in your web application. Although this is still a possible way to debug, the Pascal to Javascript compiler provides for a way easier method to debug your code as original Pascal code when using the Google Chrome or the Mozilla Firefox browser debugger.

So, when you launch your web application in debug mode, with the help of an automatic generated map file, the Google browser debugger allows you to step through your original Pascal source code, inspect values, use watches, set breakpoints etc.. pretty much the same way as you would do from the Delphi IDE. So, all in all, this offers excellent debugging facilities for your web applications when using the Google Chrome browser or Mozilla Firefox browser.
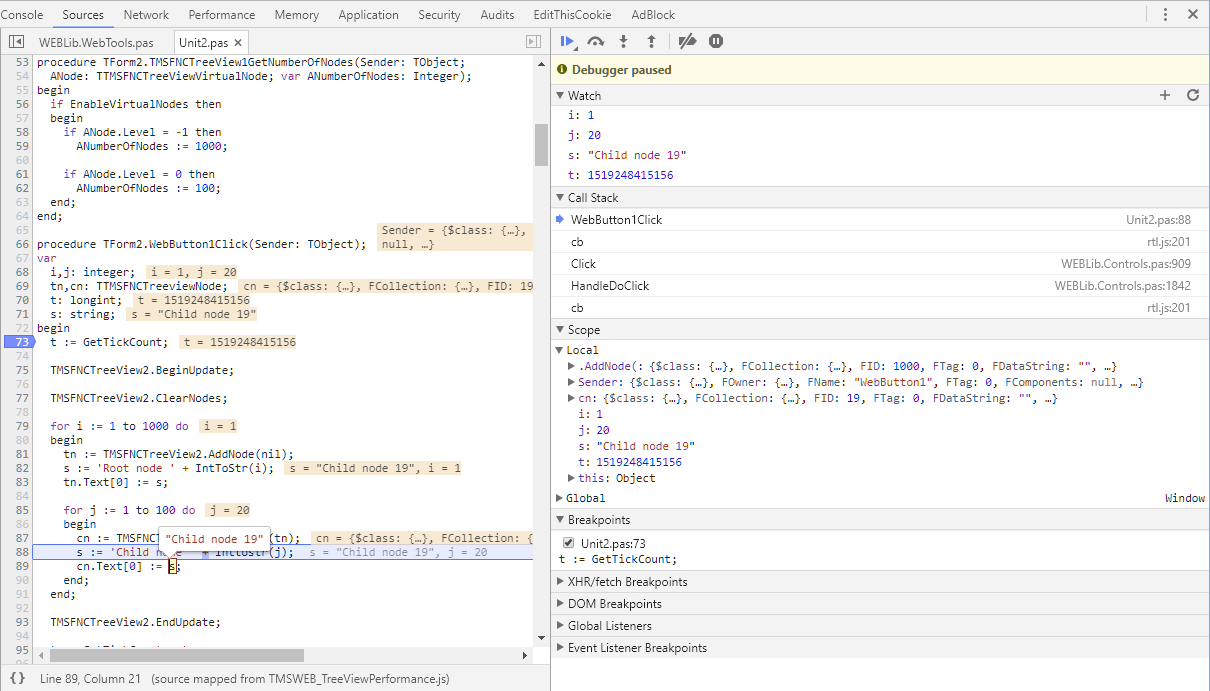
So, with TMS WEB Core, if you compile in debug mode, this extra map file is generated that allows you to debug from the browser in Pascal code and when you compile in release mode, this map file is not generated and your Pascal code is not visible to users.
Get started today: Technical previews of TMS WEB Core, TMS FNC UI web-enabled controls, web-enabled TMS XData, the first parts under the TMS RADical WEB umbrella are exclusively available now for all active TMS-ALL-ACCESS customers.
Bruno Fierens

This blog post has received 13 comments.
2. Thursday, February 22, 2018 at 4:07:11 PM
....Allen Bauer must feel a little bit pursued :)
Schachtner Andreas
 3. Thursday, February 22, 2018 at 4:28:41 PM
We hope he likes it :)
3. Thursday, February 22, 2018 at 4:28:41 PM
We hope he likes it :)
Bruno Fierens
4. Friday, February 23, 2018 at 2:04:12 AM
Very clever feature. I think we will soon be running out of superlatives so remembering my international commentating days for Horse Trials and other equestrian events one has to pace oneself so that the truly amazing performances (features) get the right level of superlative. Trouble here is that Bruno and his TMS Software Team are rolling out many amazing features and I can well imagine there are more just around the corner. Brilliant so far. Every day in hospital is an excitement right now!
Francis Moore
5. Monday, March 19, 2018 at 3:30:37 AM
I can''t get this working. I can debug in JS, I can open the pas file and put a breakpoint in the Delphi code, but the Delphi code is not mapped back to the java script.I have tried adding a map file to the JS file.
I am guessing there is some step I am missing. It would be good to get a step by step walkthrough of how to get Delphi code mapped to the JS.
Note: I have been trying this with the "Simple" demo, and the Chrome browser.
van der Linden Scott
6. Monday, March 19, 2018 at 3:52:33 AM
Aha! The magic of <ctrl>+pTurns out, If I open the file through the <ctrl>+p lookup it all works. It is also much simpler to get debug going.
van der Linden Scott
7. Monday, March 19, 2018 at 4:12:52 AM
The mapping is unreliable. In the Simple demo, when I breakpoint WebComboBox1Change, I get the webLabel1 object correct, WebLabel1.Caption links to the WEBLib.StdCtrls.pas unit but doesn''t resolve. WebCombobox1 and WebCombobox1.Items resolve correctly, however WebCombobox1.ItemIndex does not (similar to Caption above)When I breakpoint on the second line of WebButton1Click I get the objects in the first line correctly (same behaviour as above), but the second line objects fail. On the third line WebMemo1 works, WebMemo1.Lines does not, neither does WebEdit1.
van der Linden Scott
8. Wednesday, March 21, 2018 at 8:14:39 PM
What browser do you use? We mostly use Chrome here and haven''t seen such issues.
Bruno Fierens
9. Wednesday, December 30, 2020 at 1:09:14 PM
I compile my application in debugger mode but it doesn''t generate the mapping file, how can I solve it?
Note: I am using Chrome and a Trial version.
Fábio Ramos
10. Wednesday, December 30, 2020 at 8:03:42 PM
For debugging to work, you need the full registered version of TMS WEB Core as this comes with the full source code of the framework. If you want to debug from Pascal source code, you therefore need the registered version that comes with this source code.
Bruno Fierens
11. Friday, May 14, 2021 at 2:19:12 PM
Old blog, but for me still actual. Debugging in IDE doesn''t work. The breakpoints I place are ignored. I compile in debug mode and produce a detailed map file. I use the registered version of Web Core 1.7.0.1 and Chrome 90.0.4430.212.
Dutoict Christophe
12. Friday, May 14, 2021 at 2:23:29 PM
You have to debug inside the browser. And the breakpoints are not ignored, the browser automatically stops at a breakpoint you set in the Delphi IDE.
Roman
13. Friday, May 14, 2021 at 3:05:49 PM
Thanks for the reply, Roman. I found out how it works now.
Dutoict Christophe
All Blog Posts | Next Post | Previous Post
Best Regards,
FK
Ferruh KÖROĞLU