Blog
All Blog Posts | Next Post | Previous Post

 The Next Evolution of Charting in Delphi: Data Import & Export
Wednesday, March 11, 2026
Data Import and Export with TMS FNC Chart
A chart is only as useful as the data behind it. In this second installment of the TMS FNC Chart video series, we look at the four ways you can bring data into a chart — from in-memory collections to CSV files, structured JSON, and event-driven virtual data — and how to push the finished result out to PDF or SVG with just a few lines of code.
Watch The Video
Watch the full walkthrough on YouTube:
Quick Highlights
Four data modes: in-memory collection, CSV file, JSON file, and virtual/event-driven.
One-line CSV and JSON import with
LoadFromCSVDataandLoadFromJSONData.Enrich imported data with calculated series — moving averages, derived profit, and trend lines.
Export the chart to PDF or SVG with a handful of lines of code.
Four Ways to Feed Your Chart
TMS FNC Chart supports four distinct data modes. As shown in the video, all four modes share the same chart component and the same presentation controls, which makes it easy to see how flexible the data layer is.
Highlight: Same chart, same presentation options, four completely different data sources.
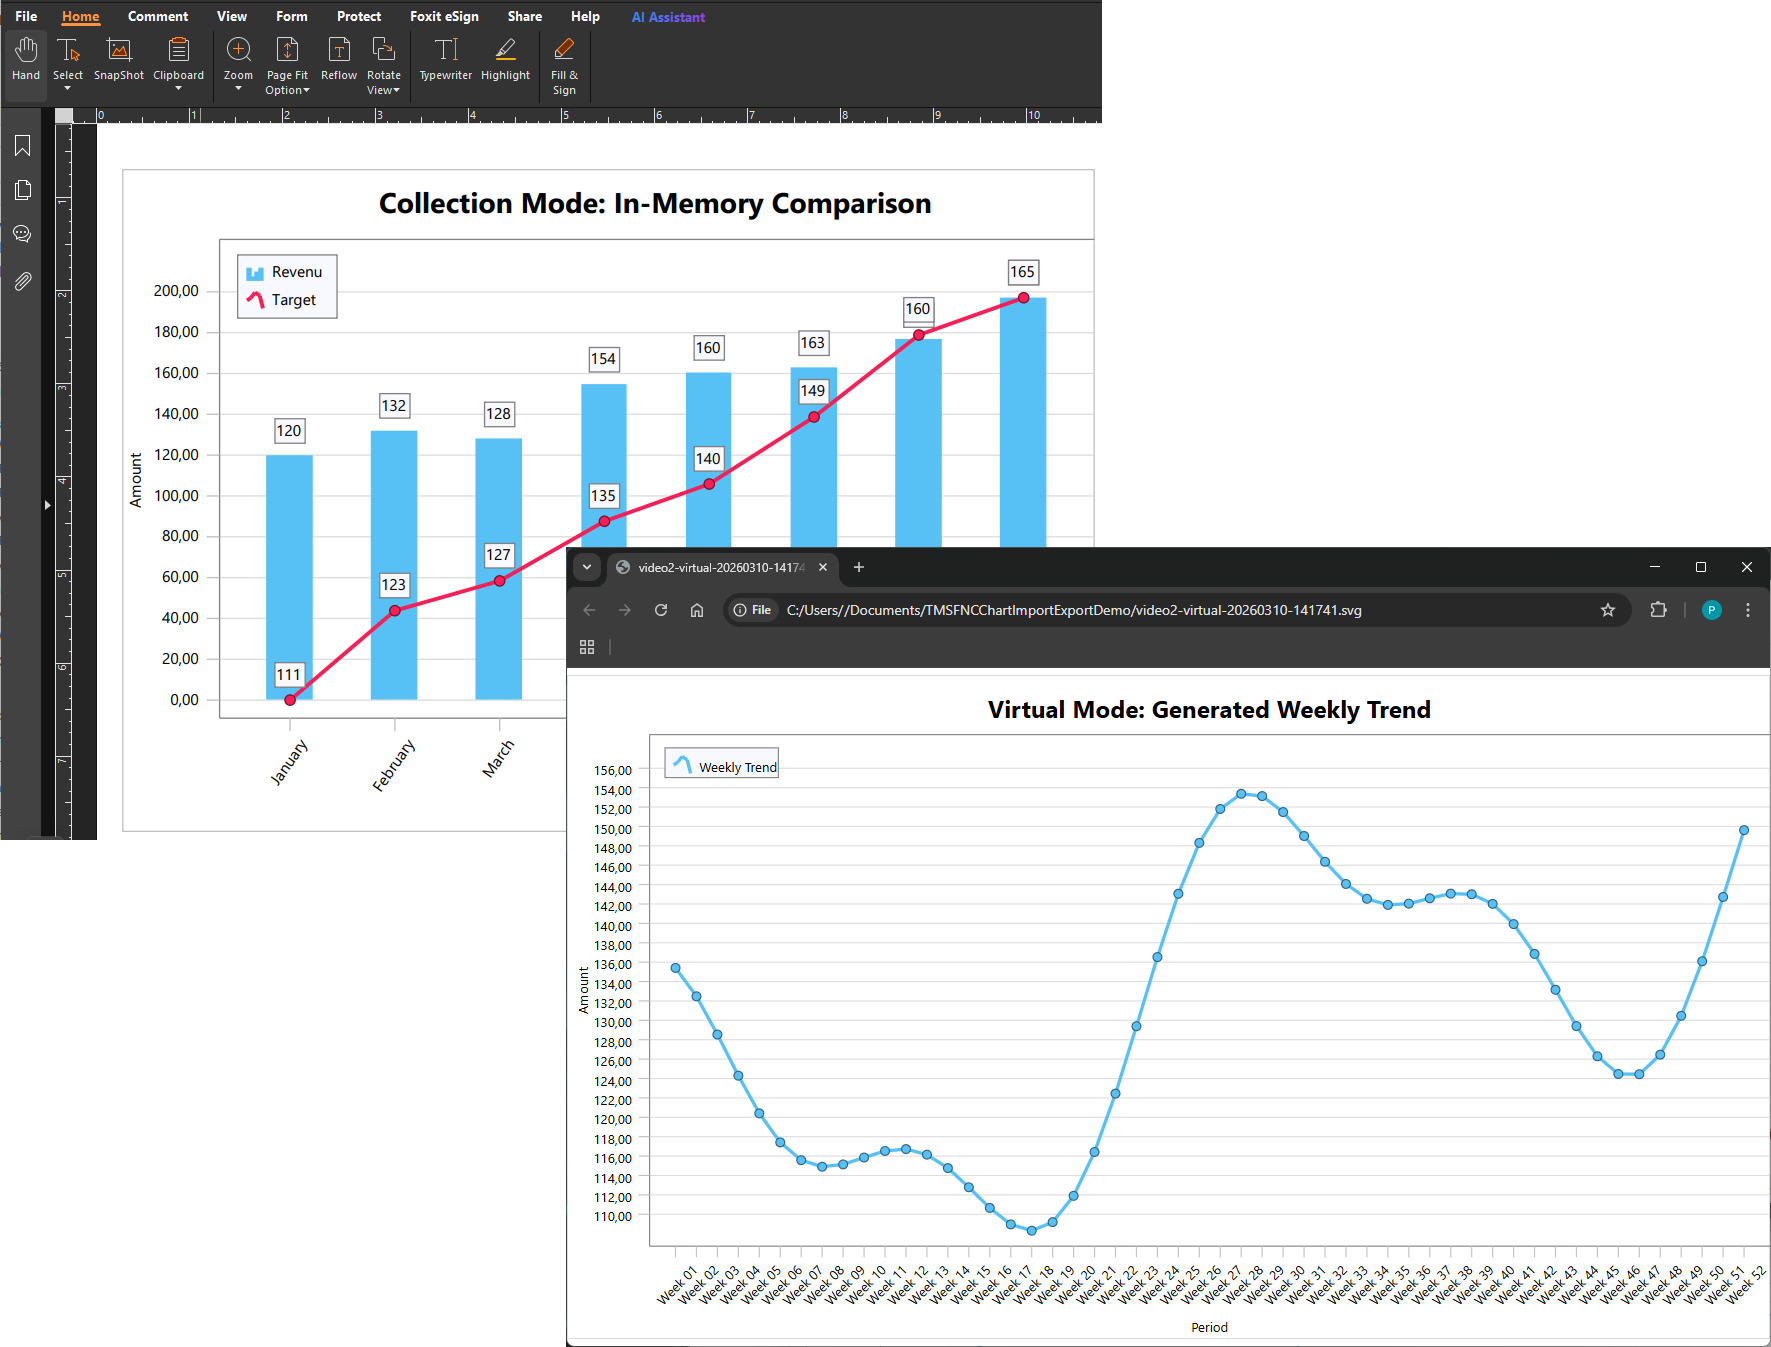
Mode 1 — In-Memory Collection
The simplest path is building series directly in code. In the video, a Revenue and a Target series are generated with light random variation on top of a base dataset, then added to the chart using a small helper:
procedure TFormImportExport.AddSerie(const ALegendText: string;
  const ALabels: TStringArray; const AValues: TDoubleArray);
var
  I: Integer;
  Serie: TTMSFNCChartSerie;
begin
  Serie := TMSFNCChart1.Series.Add;
  Serie.LegendText := ALegendText;

  for I := 0 to Min(High(ALabels), High(AValues)) do
    Serie.AddPoint(AValues[I], ALabels[I]);
end;
Because everything lives in memory, hitting Refresh produces a fresh variation of the data in under a millisecond — no file I/O, no parsing. This makes collection mode ideal for dashboards fed from a database or computed at runtime.
Highlight: In-memory series are instantly refreshable and trivially restyled without touching any file.
Mode 2 — CSV Import
For data that arrives as a flat text file, LoadFromCSVData does the heavy lifting. A TTMSFNCChartLoadOptions object controls how the file is interpreted: which delimiter to use, whether the first line is a header, and how the axes should be ranged.
LoadOptions := TTMSFNCChartLoadOptions.Create;
try
  LoadOptions.ClearSeries     := True;
  LoadOptions.CSVFirstLine    := cflFirstLineSkip;
  LoadOptions.XRange          := arEnabled;
  LoadOptions.YRange          := arEnabledZeroBased;
  LoadOptions.XGrid           := False;
  LoadOptions.YGrid           := True;
  LoadOptions.CSVDelimiter    := ',';

  TMSFNCChart1.LoadFromCSVData(FileName, LoadOptions, [1], -1, 0);
finally
  LoadOptions.Free;
end;
The column index array [1] tells the importer which column holds the Y-values, while 0 selects the label column. The result is a bar chart for raw sales overlaid with a smooth trend line — more information than the file alone could provide.
Highlight: Import a CSV in one call, then add calculated overlay series to tell a richer story.
Mode 3 — JSON Import
When the data source is a structured JSON report, LoadFromJSONData navigates the object hierarchy for you. You supply the names of the root object, the row array, and the value fields you want as series:
TMSFNCChart1.LoadFromJSONData(
  FileName,
  LoadOptions,
  'report',         // root object key
  'rows',           // array key inside root
  ['revenue', 'expenses'],  // value fields → one series each
  nil,
  ['month']);       // label field
This single call produces two series from a file shaped like:
{ "report": { "rows": [
  { "month": "January", "revenue": 142, "expenses": 98 },
  ...
] } }
Highlight: Navigate nested JSON structures with a single call and derive extra series from the imported data.
Mode 4 — Virtual / Event-Driven Data
When data is too large to store in chart points, or when values are computed on demand, virtual mode is the right choice. Instead of populating series with AddPoint, you wire up two events and let the chart ask for data only when it needs to render:
TMSFNCChart1.OnGetNumberOfPoints := TMSFNCChart1GetNumberOfPoints;
TMSFNCChart1.OnGetPoint          := TMSFNCChart1GetPoint;
The event handlers are minimal:
procedure TFormImportExport.TMSFNCChart1GetNumberOfPoints(Sender: TObject;
  ASerie: TTMSFNCChartSerie; var ANumberOfPoints: Integer);
begin
  ANumberOfPoints := Length(FVirtualValues);
end;

procedure TFormImportExport.TMSFNCChart1GetPoint(Sender: TObject;
  ASerie: TTMSFNCChartSerie; AIndex: Integer;
  var APoint: TTMSFNCChartPointVirtual);
begin
  APoint.Index      := AIndex;
  APoint.XValue     := AIndex;
  APoint.XValueText := FVirtualLabels[AIndex];
  APoint.YValue     := FVirtualValues[AIndex];
end;
In the video, 52 weekly data points are built from a sine/cosine wave with a drift factor. Refreshing generates a new wave while the same event pattern stays in place, showing that the chart never holds a copy of the data at all.
Highlight: Virtual mode keeps memory usage flat no matter how many points the dataset contains.
Exporting to PDF and SVG
Once a chart looks the way you want it, two export paths are available out of the box.
PDF export uses TTMSFNCGraphicsPDFIO and renders the chart directly into a landscape PDF page:
PDFIO := TTMSFNCGraphicsPDFIO.Create(nil);
try
  PDFIO.Options.OpenInPDFReader  := False;
  PDFIO.Options.PageOrientation  := poLandscape;
  PDFIO.ExportObject             := TMSFNCChart1;
  PDFIO.Save(FileName);
finally
  PDFIO.Free;
end;

TTMSFNCUtils.OpenFile(FileName);
SVG export works through the ITMSFNCGraphicsExport interface that TTMSFNCChart implements. You create an SVG canvas at the exact pixel size of the chart, call Export, and write the result to disk:
ExportWidth  := Round(TMSFNCChart1.Width);
ExportHeight := Round(TMSFNCChart1.Height);

SVG := TTMSFNCGraphicsSVG.Create(ExportWidth, ExportHeight);
try
  SVG.BeginScene;
  try
    Exporter := TMSFNCChart1 as ITMSFNCGraphicsExport;
    Exporter.Export(SVG, RectF(0, 0, ExportWidth, ExportHeight));
  finally
    SVG.EndScene;
  end;

  TFile.WriteAllText(FileName, SVG.Build, TEncoding.UTF8);
finally
  SVG.Free;
end;

TTMSFNCUtils.OpenFile(FileName);
Both formats are vector-based, so charts remain sharp at any resolution — suitable for reports, slides, or web embeds.
Highlight: PDF and SVG export share the same rendering pipeline as the screen, so what you see is exactly what you get.
Conclusion
TMS FNC Chart covers the full data lifecycle: bring data in from memory, CSV, or JSON, extend it with calculated series, display it with configurable presentation options, and push the result out to PDF or SVG. Virtual mode keeps the door open for large or streaming datasets without any extra architecture. Together these four modes and two export paths cover the majority of real-world charting workflows in a single component. The next post in the series goes deeper into layout and advanced visual customization.
Pieter Scheldeman
Related Blog Posts
-
TMS FNC Chart 4.0
-
The Next Evolution of Charting in Delphi: Getting Started
-
The Next Evolution of Charting in Delphi: Data Import & Export
-
The Next Evolution of Charting in Delphi: Look & Feel
-
The Next Evolution of Charting in Delphi: Data Binding
-
The Next Evolution of Charting in Delphi: Multipoint Series

This blog post has not received any comments yet.
All Blog Posts | Next Post | Previous Post