Blog
All Blog Posts | Next Post | Previous Post

 How to use FlexCel TMS library features in an Embarcadero Delphi FMX app with an Excel template.
Monday, February 24, 2025
Softacom is a certified consulting partner of TMS Software and an official consulting and training partner of Embarcadero. They are experts in migration and modernization software built using legacy languages and platforms or obsolete technologies, using modern programming languages, frameworks and databases.
Previously, Softacom explored saving various types of data (numerical arrays and a sinusoidal function diagram) to an Excel file using the TMS FlexCel library in our Embarcadero Delphi FMX application.
However, in that approach, the sinusoidal function diagram was saved in the Excel document a
s an image. This method does not allow for dynamic redrawing of the graph when modifying its values or arguments during editing in Microsoft Excel.
s an image. This method does not allow for dynamic redrawing of the graph when modifying its values or arguments during editing in Microsoft Excel.
In this article, we will demonstrate how to solve the issue of updating the function graph in a generated Excel document using a pre-prepared Excel document template and our Embarcadero Delphi FMX application.
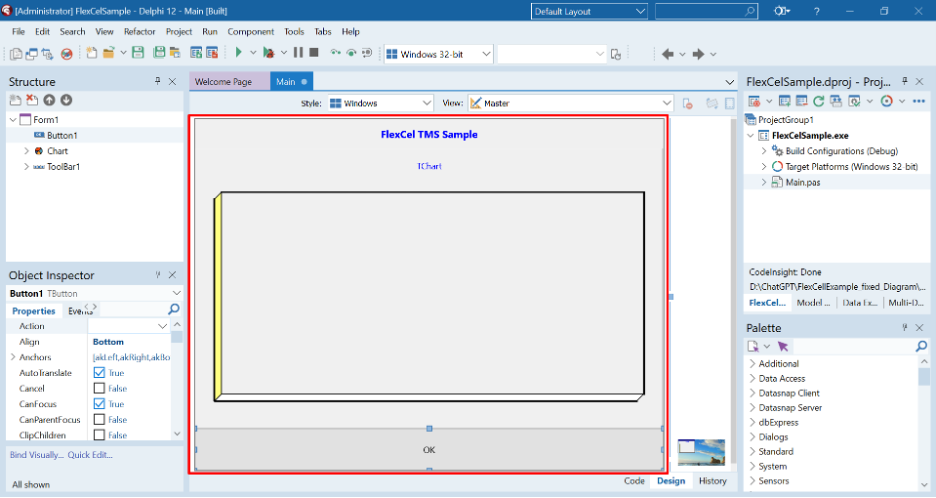
Details on how to download, install, and configure TMS FlexCel components, tabulate a sinusoidal function, and plot its graph using the TChart component in our Embarcadero Delphi FMX application can be found in this article on the Softacom blog: How to use FlexCel TMS library via Delphi app.
To create the template, we will use the Excel file with the sinusoidal graph diagram in image format, which was generated in the application discussed in the previous article. Open this file in Microsoft Excel. We will delete the generated image of the sinusoidal function graph from the file.
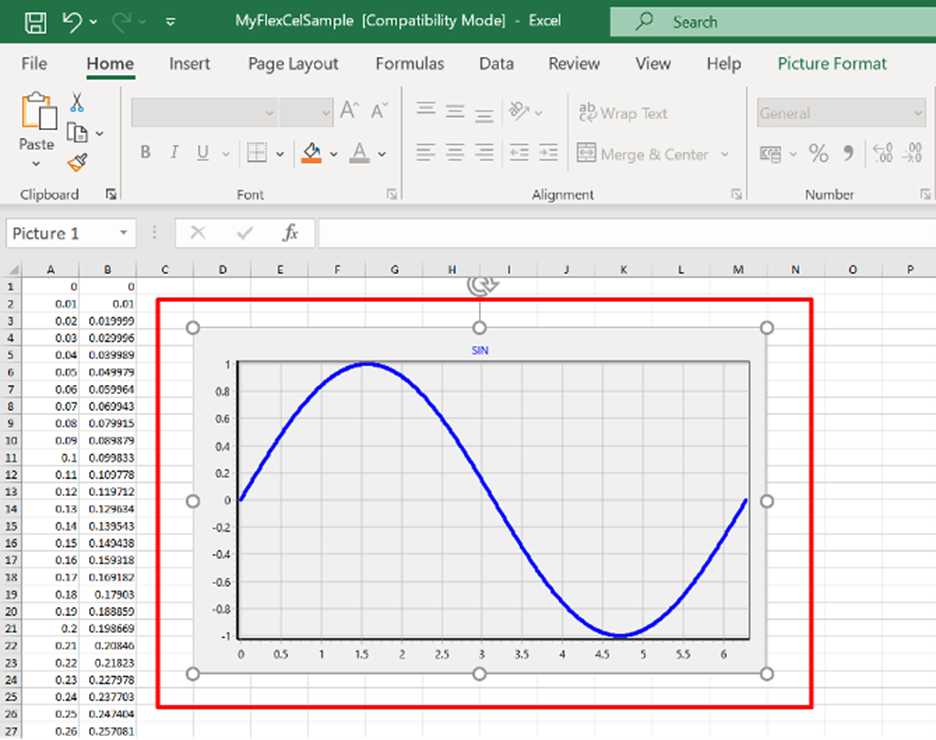
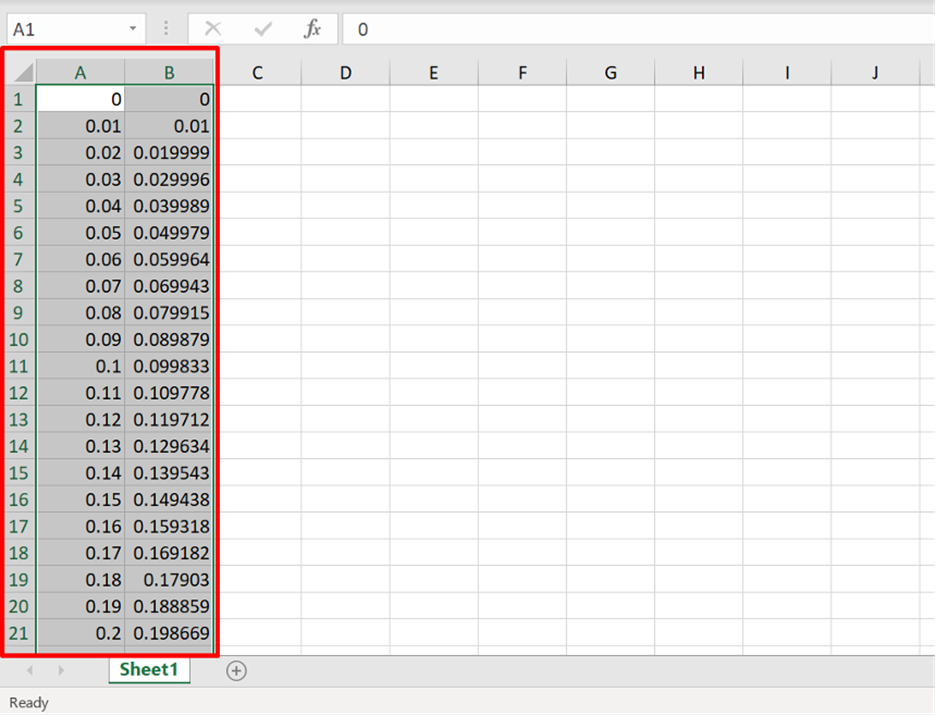
We will highlight the data range in the Excel document to build the graph.
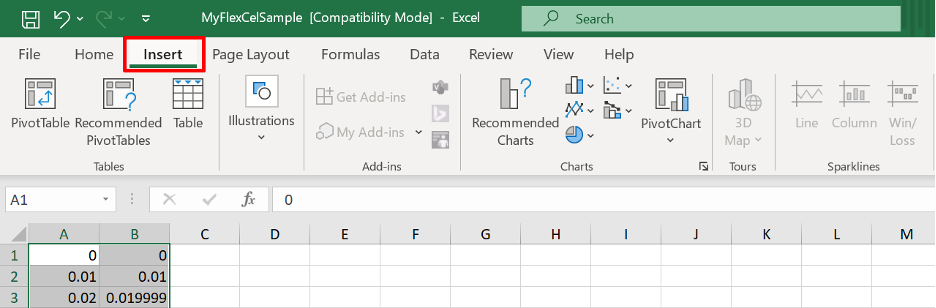
Next, go to the "Insert" tab.
Select a chart of the "solid line" type.
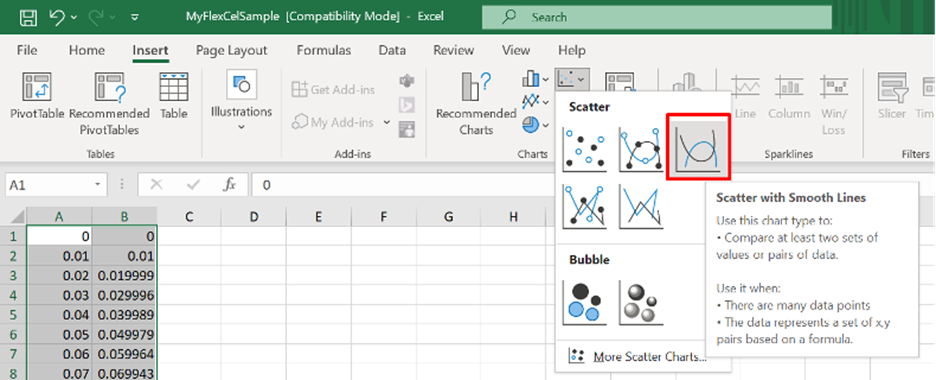
We get the following result:
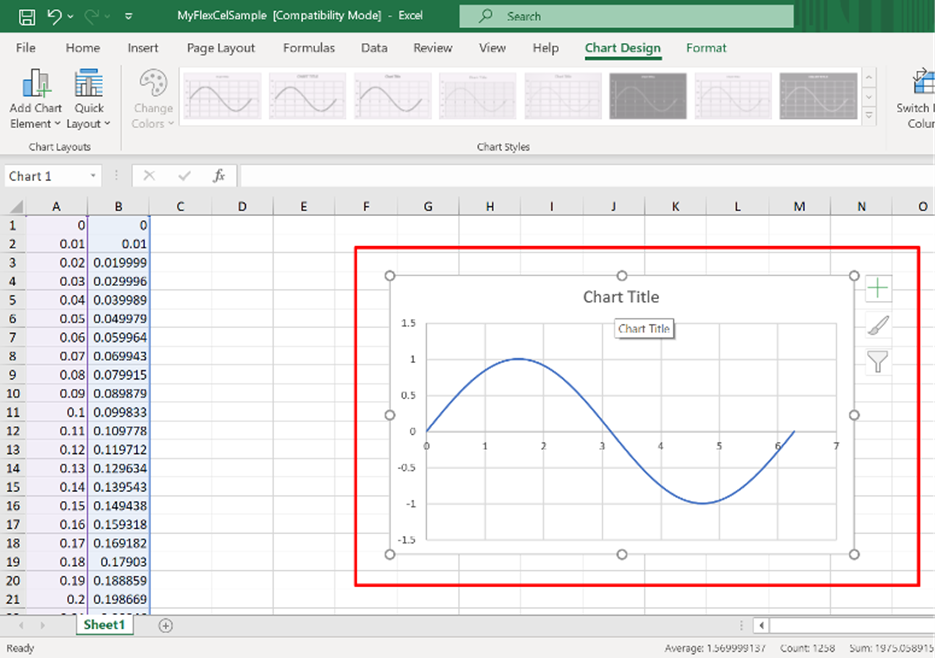
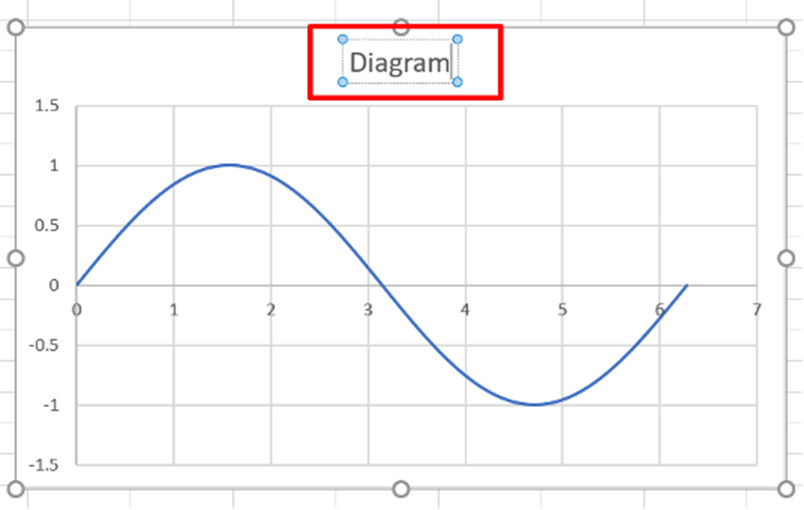
Rename the chart (assign it a name, for example, "Diagram").
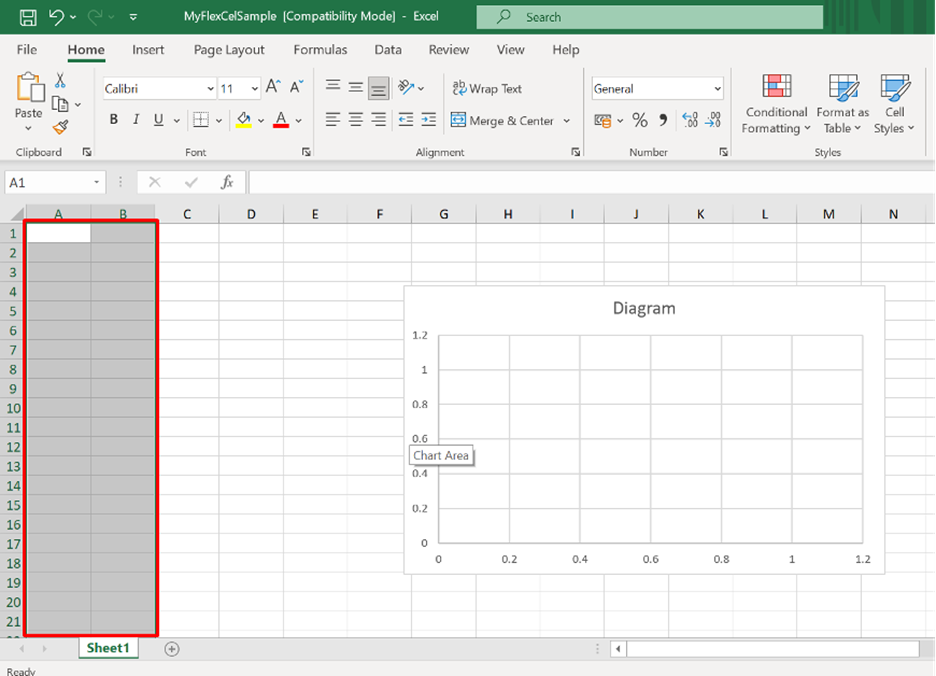
Now delete the data arrays (the values of the argument and the function) from our future template.
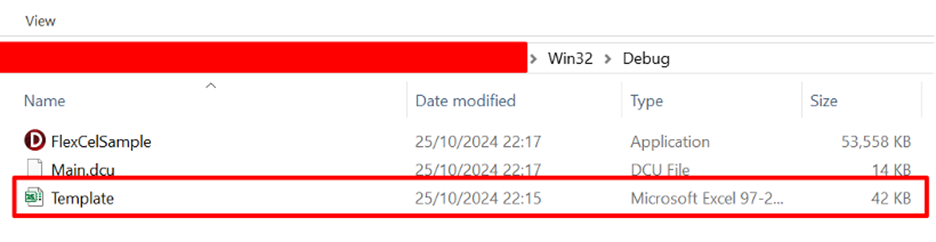
Next, rename our Excel document. For example, call it "Template.xls" and copy it into the folder containing the executable file of our Embarcadero Delphi FMX application.
We will update the program code of our Embarcadero Delphi FMX application from the article "How to use FlexCel TMS library via Delphi app" to enable the use of the "Template.xls" Excel file as a template.
This modification will significantly simplify the code, as we will remove the functionality for generating and saving the sine function chart to an Excel document file. The application's interface will remain unchanged.
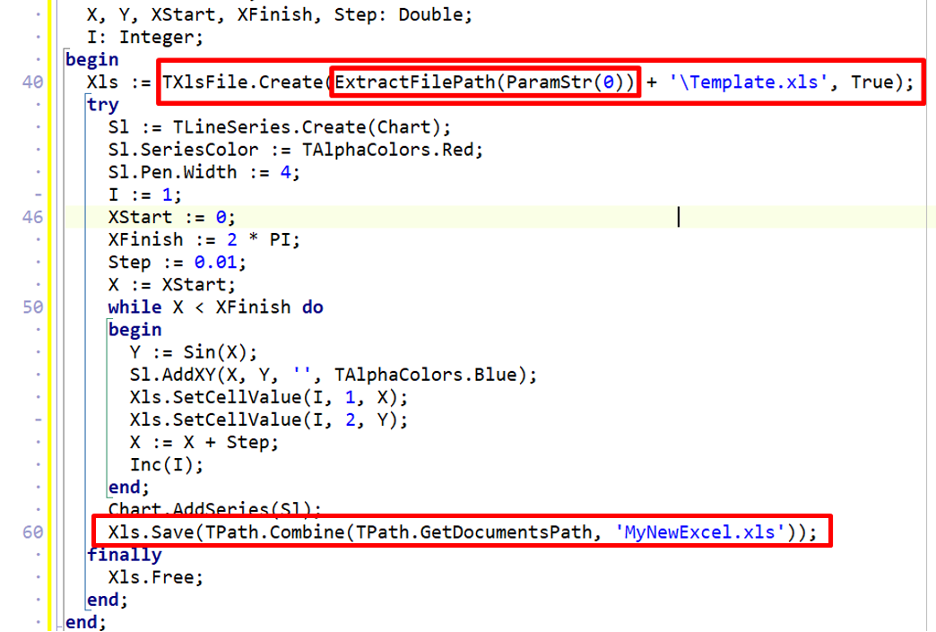
To load the Excel document from the pre-prepared template (the "Template.xls" file located in the same folder as the executable file of our Embarcadero Delphi FMX application), we will use the constructor method TXlsFile.Create. To automatically determine the path to the template file, which is in the same folder as the exe file, we will use the function ExtractFilePath.
Once the sine function values have been calculated, we will save the data arrays (the argument values and function values) and the chart itself into the Excel file in the "Documents" folder. This ensures that the result is saved correctly and that the application will not require manual file management.
The full source code of the Main module is provided below.
unit Main;

interface

uses
  System.SysUtils, System.Types, System.UITypes, System.Classes, System.Variants,
  FMX.Types, FMX.Controls, FMX.Forms, FMX.Graphics, FMX.Dialogs,
  FlexCel.Core, FlexCel.XlsAdapter, FMX.Controls.Presentation, FlexCel.FMXSupport,
  FMX.StdCtrls,FMXTee.Engine, FMXTee.Procs, FMXTee.Chart, FlexCel.Render,
  FMXTee.Series, Math, System.IOUtils, ShellAPI;

type
  TForm1 = class(TForm)
	Button1: TButton;
	Chart: TChart;
	ToolBar1: TToolBar;
	Label1: TLabel;
	procedure Button1Click(Sender: TObject);
	procedure FormShow(Sender: TObject);
  private
	{ Private declarations }
  public
	{ Public declarations }
  end;

var
  Form1: TForm1;

implementation

{$R *.fmx}

procedure TForm1.Button1Click(Sender: TObject);
var
  Xls: TXlsFile;
  Sl: TLineSeries;
  X, Y, XStart, XFinish, Step: Double;
  I: Integer;
begin
  Xls := TXlsFile.Create(ExtractFilePath(ParamStr(0)) + '\Template.xls', True);
  try
	Sl := TLineSeries.Create(Chart);
	Sl.SeriesColor := TAlphaColors.Red;
	Sl.Pen.Width := 4;
	I := 1;
	XStart := 0;
	XFinish := 2 * PI;
	Step := 0.01;
	X := XStart;
	while X < XFinish do
	begin
  	Y := Sin(X);
  	Sl.AddXY(X, Y, '', TAlphaColors.Blue);
  	Xls.SetCellValue(I, 1, X);
  	Xls.SetCellValue(I, 2, Y);
  	X := X + Step;
  	Inc(I);
	end;
	Chart.AddSeries(Sl);
	Xls.Save(TPath.Combine(TPath.GetDocumentsPath, 'MyNewExcel.xls'));
  finally
	Xls.Free;
  end;
end;

procedure TForm1.FormShow(Sender: TObject);
begin
  Chart.Legend.Visible := False;
  Chart.View3D := False;
  Chart.Title.Text.Clear;
  Chart.Title.Text.Add('SIN');
end;

end.
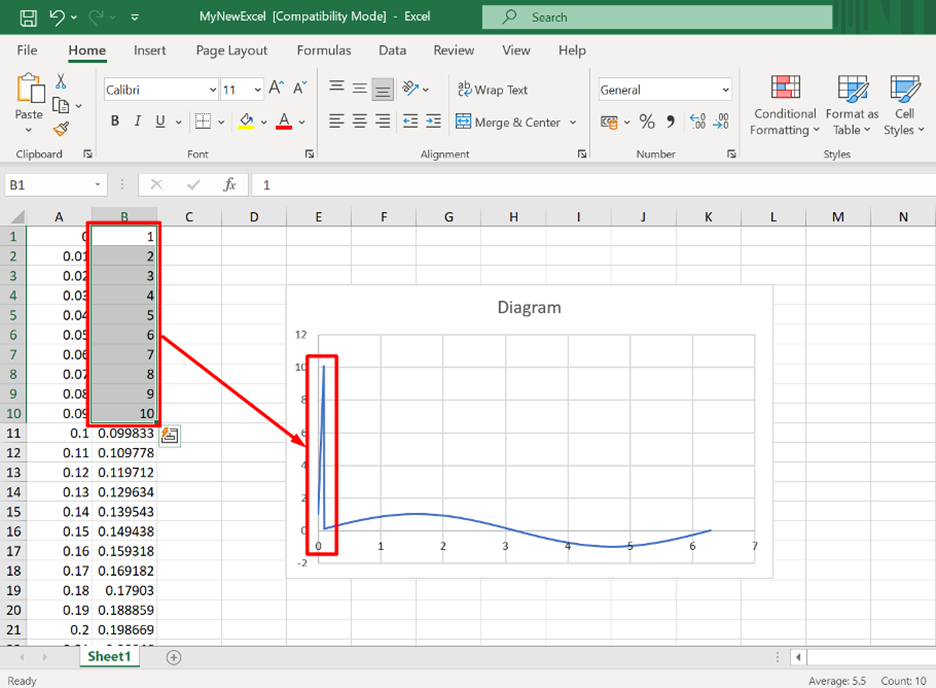
Let's check the functionality of our Embarcadero Delphi FMX application.
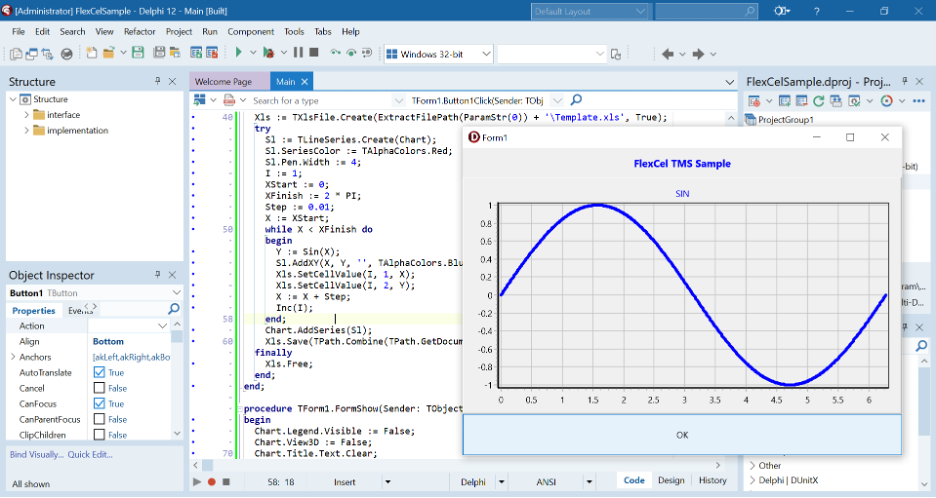
When the 'OK' button is pressed, our template is loaded, the sine function is tabulated, the chart is created, and the data is saved to an Excel file in the 'Documents' folder.
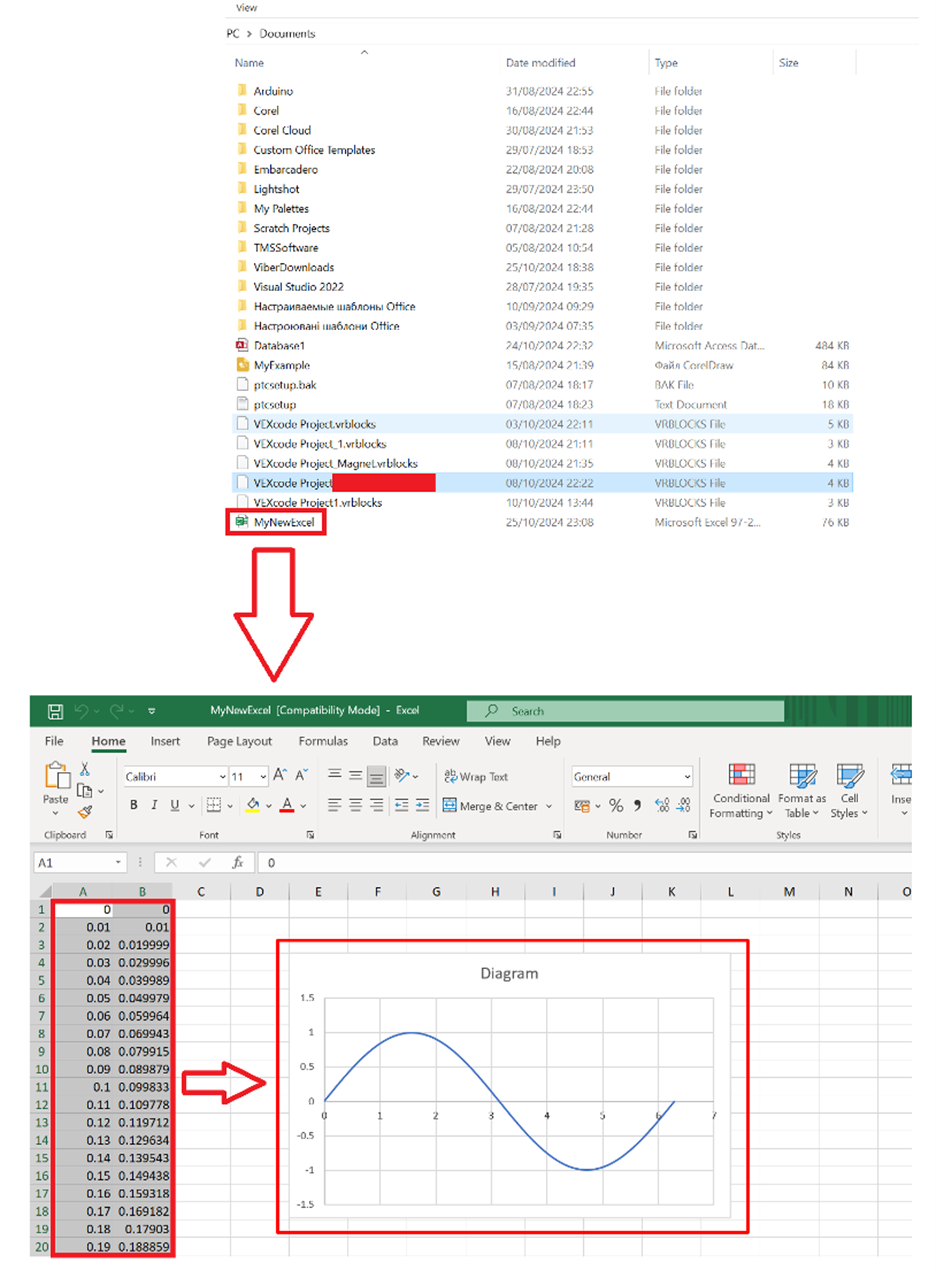
Now, if we change the value in the cell, we will immediately see the result of the changes on the chart.
Written by Softacom, reviewed by Adrian Gallero
Written by Softacom, reviewed by Adrian Gallero
Aaron Decramer

This blog post has not received any comments yet.
All Blog Posts | Next Post | Previous Post