Frequently Asked Component Specific Questions
Options |
|
Display all FAQ items |
Displaying items 1 to 1 of 1, page 1 of 1
<< previous next >>

 TMS VCL Chart
Adding Special Series
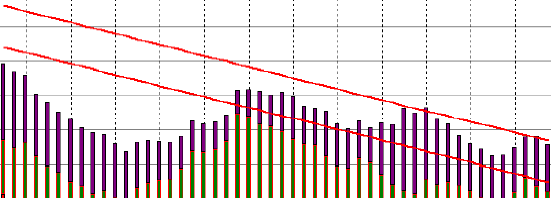
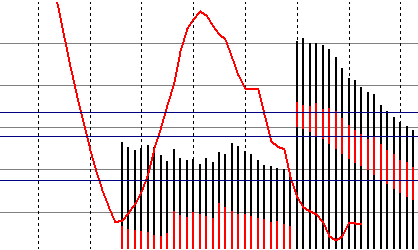
TMS Advanced Charts allows you to add trend lines, moving averages, line series and band series. This series is not visible in the legend and will be used as an extra calculated data � series. These series are automatically calculated from specific values in a defined range from series available in the chart. As such, it is mandatory to first add the series values and when values are added, call the method to calculate the trend line series, moving averages series etc�
Trend Channel
Moving Average
Below are the method definitions that can be used to add informational series to the chart.
procedure AddLineSerie(startx, endx: integer; startvalue, endvalue: Double; UseCommonYRange: Boolean = true; serielinecolor: TColor = clBlack; serielinewidth: integer = 1);

procedure AddBandSerie(startx, endx: integer; startvalue1, startvalue2, endvalue1,endvalue2: Double; UseCommonYRange: Boolean = true; serielinecolor: TColor = clBlack; serielinewidth: integer = 1;seriebandcolor: TColor = clGray);

procedure AddTrendLine(serieindex, startx, endx: integer; UseCommonYRange: Boolean = true; serielinecolor: TColor = clBlack; serielinewidth: integer = 1);

procedure AddTrendChannel(serieindex, startx, endx: integer; UseCommonYRange: Boolean = true; serielinecolor: TColor = clBlack; serielinewidth: integer = 1);

procedure AddTrendChannelBand(serieindex, startx, endx: integer; UseCommonYRange: Boolean = true; serielinecolor: TColor = clBlack; serielinewidth: integer = 1; seriebandcolor: TColor = clGray);

procedure AddMovingAverage(serieindex, startx, endx, window: integer; UseCommonYRange: Boolean = true; serielinecolor: TColor = clBlack; serielinewidth: integer = 1);

procedure AddParetoLine(serieindex, startx, endx: integer; UseCommonYRange: Boolean = true; serielinecolor: TColor = clBlack; serielinewidth: integer = 1);