Blog
All Blog Posts | Next Post | Previous Post

 TMS FNC Chart: Visualize your Grid Data
Thursday, June 9, 2022
With the release of the new TMS FNC Chart version 2.0, it is now possible to show beautiful graphs based on the cell data in a TMS FNC Grid. This requires the installation of the TMS FNC UI Pack next to TMS FNC Chart.
TTMSFNCChartGridAdapter

The files for the TTMSFNCChartGridAdapter are available in the directory, but due to the dependencies to the TMS FNC UI Pack, they are not added to the packages by default. If you want to use the component in design-time it will be necessary to add the four different TTMSFNCChartGridAdapter units (and the Reg, DE and RegDE) with the prefix to the respective framework packages.
Setup
You can quickly set up the environment necessary to start. You need a TTMSFNCChart, a TTMSFNCGrid and the TTMSFNCChartGridAdapter.
Link the Adapter property of the TMSFNCChart to the TMSFNCChartGridAdapter.
And set the source of the TMSFNCChartGridAdapter to the TMSFNCGrid.
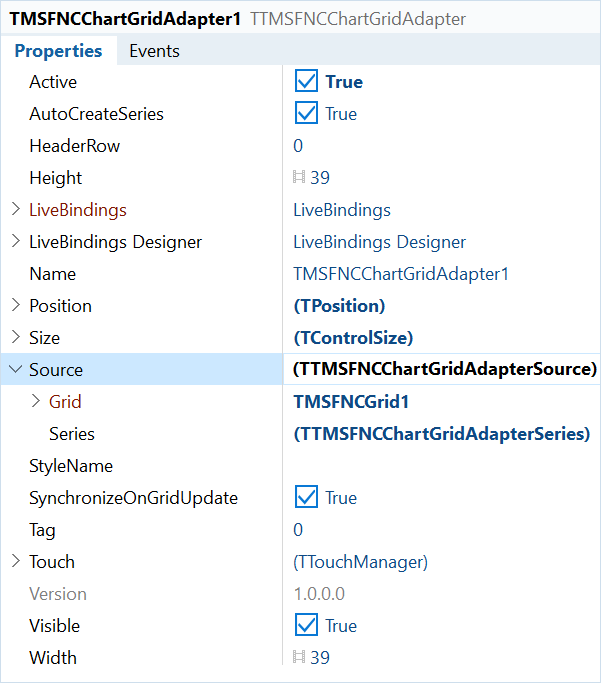
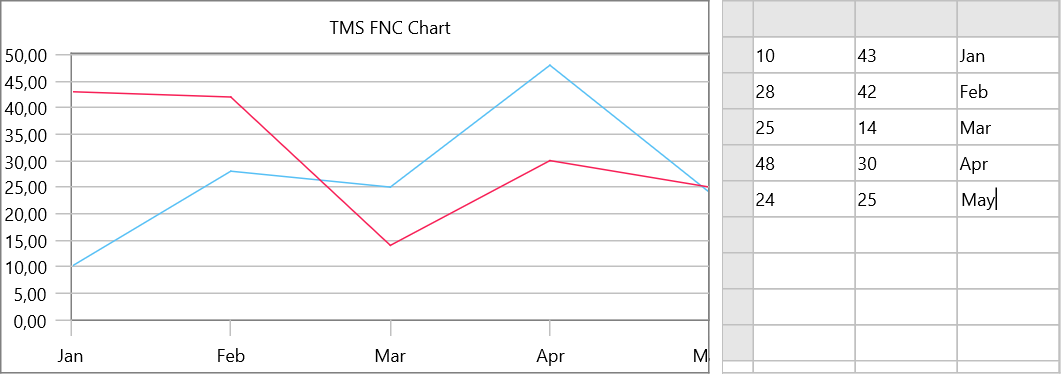
You can now already start making your graph. As the default behavior of the TMSFNCChartGridAdapter will try to create a new series for each column that has a value in the first line. If it finds a text value in the first row it will use the first column it encounters as the x-value text.
TTMSFNCChartGridAdapterSeries
If you are using a more uncommon positioning of your data or you want to use multi-point data, you can use the TMSFNCChartGridAdapterSeries. This collection contains items for the different series that should be drawn in the chart.
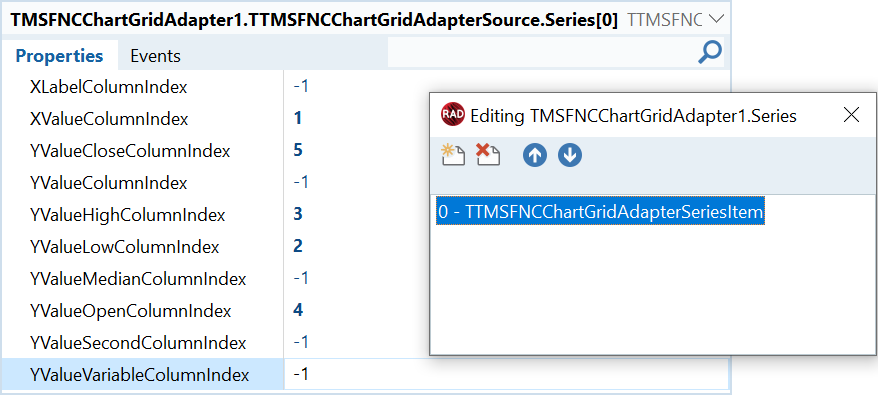
For this you'll need to set the AutoCreateSeries property of the TMSFNCChartAdapter to False and add a new series item.
There you can set the columns to use from your TMSFNCGrid.
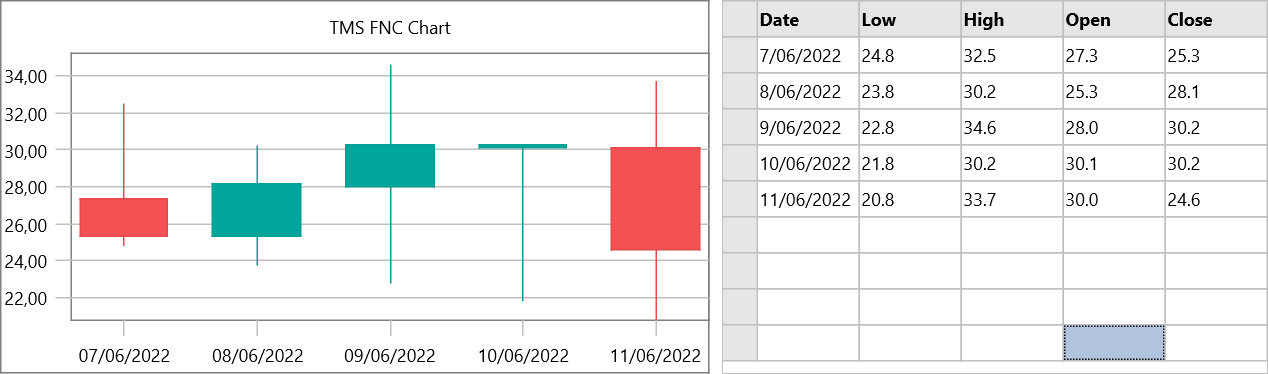
Now we set some the data in the cells. And set the format type of the X-axis to vftDateTime so it tries to parse the cell to a TDateTime format.
Because the adapter only triggers when a cell has been edited, we need to call the Synchronize procedure when changing cells in run-time.
procedure TForm.FormCreate(Sender: TObject);
begin
  TMSFNCGrid.Cells[1,0] := 'Date';
  TMSFNCGrid.Cells[2,0] := 'Low';
  TMSFNCGrid.Cells[3,0] := 'High';
  TMSFNCGrid.Cells[4,0] := 'Open';
  TMSFNCGrid.Cells[5,0] := 'Close';

  TMSFNCGrid.Cells[1,1] := '7/06/2022';
  TMSFNCGrid.Cells[1,2] := '8/06/2022';
  TMSFNCGrid.Cells[1,3] := '9/06/2022';
  TMSFNCGrid.Cells[1,4] := '10/06/2022';
  TMSFNCGrid.Cells[1,5] := '11/06/2022';

  TMSFNCGrid.Cells[2,1] := '24.8';
  TMSFNCGrid.Cells[2,2] := '23.8';
  TMSFNCGrid.Cells[2,3] := '22.8';
  TMSFNCGrid.Cells[2,4] := '21.8';
  TMSFNCGrid.Cells[2,5] := '20.8';

  TMSFNCGrid1.Cells[3,1] := '32.5';
  TMSFNCGrid1.Cells[3,2] := '30.2';
  TMSFNCGrid1.Cells[3,3] := '34.6';
  TMSFNCGrid1.Cells[3,4] := '30.2';
  TMSFNCGrid1.Cells[3,5] := '33.7';

  TMSFNCGrid.Cells[4,1] := '27.3';
  TMSFNCGrid.Cells[4,2] := '25.3';
  TMSFNCGrid.Cells[4,3] := '28.0';
  TMSFNCGrid.Cells[4,4] := '30.1';
  TMSFNCGrid.Cells[4,5] := '30.0';

  TMSFNCGrid.Cells[5,1] := '25.3';
  TMSFNCGrid.Cells[5,2] := '28.1';
  TMSFNCGrid.Cells[5,3] := '30.2';
  TMSFNCGrid.Cells[5,4] := '30.2';
  TMSFNCGrid.Cells[5,5] := '24.6';

  TMSFNCChart.DefaultLoadOptions.XValuesFormatType := vftDateTime;

  TMSFNCChartGridAdapter.Synchronize;
end;

procedure TForm.TMSFNCChartGridAdapterSynchronized(Sender: TObject);
begin
  TMSFNCChart.Series[0].ChartType := ctCandleStick;
  TMSFNCChart.Series[0].MinXOffsetPercentage := 10;
  TMSFNCChart.Series[0].MaxXOffsetPercentage := 10;
end;
Events to customize the data
To make it possible to manipulate the grid data some more, we've added a couple of events so you can set the chart to your liking.
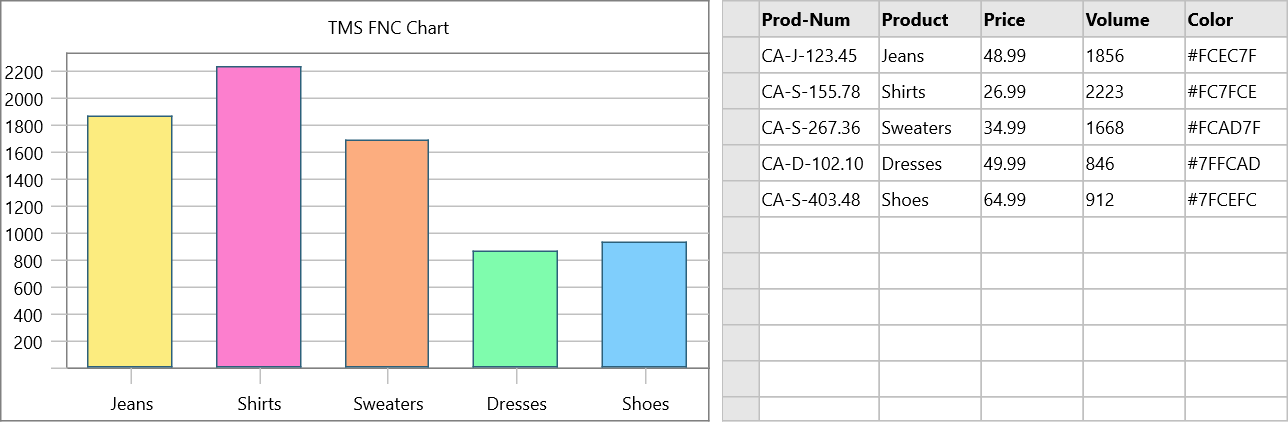
I've changed the TTMSFNCChart to a TTMSFNCBarChart, but it's also possible to set the chart type of the series in the Synchronized event.
// Example data
procedure TForm.FormCreate(Sender: TObject);
begin
  TMSFNCGrid.Cells[1,0] := 'Prod-Num';
  TMSFNCGrid.Cells[2,0] := 'Product';
  TMSFNCGrid.Cells[3,0] := 'Price';
  TMSFNCGrid.Cells[4,0] := 'Volume';
  TMSFNCGrid.Cells[5,0] := 'Color';

  TMSFNCGrid.Cells[1,1] := 'CA-J-123.45';
  TMSFNCGrid.Cells[1,2] := 'CA-S-155.78';
  TMSFNCGrid.Cells[1,3] := 'CA-S-267.36';
  TMSFNCGrid.Cells[1,4] := 'CA-D-102.10';
  TMSFNCGrid.Cells[1,5] := 'CA-S-403.48';

  TMSFNCGrid.Cells[2,1] := 'Jeans';
  TMSFNCGrid.Cells[2,2] := 'Shirts';
  TMSFNCGrid.Cells[2,3] := 'Sweaters';
  TMSFNCGrid.Cells[2,4] := 'Dresses';
  TMSFNCGrid.Cells[2,5] := 'Shoes';

  TMSFNCGrid.Cells[3,1] := '48.99';
  TMSFNCGrid.Cells[3,2] := '26.99';
  TMSFNCGrid.Cells[3,3] := '34.99';
  TMSFNCGrid.Cells[3,4] := '49.99';
  TMSFNCGrid.Cells[3,5] := '64.99';

  TMSFNCGrid.Cells[4,1] := '1856';
  TMSFNCGrid.Cells[4,2] := '2223';
  TMSFNCGrid.Cells[4,3] := '1668';
  TMSFNCGrid.Cells[4,4] := '846';
  TMSFNCGrid.Cells[4,5] := '912';

  TMSFNCGrid.Cells[5,1] := '#FCEC7F';
  TMSFNCGrid.Cells[5,2] := '#FC7FCE';
  TMSFNCGrid.Cells[5,3] := '#FCAD7F';
  TMSFNCGrid.Cells[5,4] := '#7FFCAD';
  TMSFNCGrid.Cells[5,5] := '#7FCEFC';

  TMSFNCChartGridAdapter.Synchronize;
end;
procedure TForm1.TMSFNCChartGridAdapterSetColumnValueType(Sender: TObject;
  AColumn: Integer; ACell: string; var AValueType: TTMSFNCChartPointValueType);
begin
  if AColumn = 2 then
    AValueType := cvtXLabel
  else if AColumn = 3 then
    AValueType := cvtNone;
end;procedure TForm1.TMSFNCChartGridAdapterRowToPoint(Sender: TObject; ARow: Integer; ASeries: TTMSFNCChartSerie; APoint: TTMSFNCChartPoint); begin APoint.Color := TTMSFNCGraphics.HTMLToColor(TMSFNCGrid.Cells[5, ARow]); end;
Gjalt Vanhouwaert

This blog post has received 1 comment.
All Blog Posts | Next Post | Previous Post
Dedi Supardi