Blog
All Blog Posts | Next Post | Previous Post

 Cryptocurrency tracking in Delphi with FNC Chart
Thursday, May 19, 2022
We, as developers, seek for new exciting APIs, new components that offer that little bit extra, or something completely new and mindblowing. As component developers, it's a daily quest to put new and exciting features into our components, and offer them to our customers. Now, the FNC framework offers a lot of components to complete various tasks. Even when being excited to create a lot of new components, it's often good to reflect on what has been done already and see where we can improve.
TMS FNC Chart was the first FNC product and was an introduction into cross-platform, cross-framework and cross-IDE development. At the time it was released, VCL and FMX were supported. Later we added Lazarus, and TMS WEB Core support. More time was required to support multiple frameworks and operating systems and iron out all the differences. We immediately had an idea to create more UI components which resulted in the variety of FNC framework based component sets we have today.
Meanwhile, we decided it was time to go back to the beginning, to our very first FNC product and see what can be improved. Today, we want to reveal some new and exciting features coming up in v2.0 as well as a small sample on what that means for you as a customer/developer.
TMS FNC Chart v2.0 
Coming up in v2.0
- Inherited types: TTMSFNCChart was the only component available, and the series types had to be changed there, each time a new instance of TTMSFNCChart was used. In v2.0 we introduce inherited types, which means that there will be a descendant class type for each series type, for example: TTMSFNCBarChart, TTMSFNCLineChart, TTMSFNCPieChart, ... . Using these new set of classes will preset the series type upon creation, adding new series will also be the correct type and there is a designtime preview that will resemble more what the chosen type should represent.
- Appearance & color themes: The chart displays various elements such as a title, x-axis, y-axis and each of those elements can be customized with a lot of properties. Changing the overal look & feel of the chart can take quite some time. In v2.0 we want to introduce a global appearance, which applies font name, color and the ability to up-scale all fonts in the chart in one go. Additionally, we also wanted to make the chart more color friendly and dynamic. 2.0 introduces a new custom color list, excel style and monochromatic colors.
- Data import: The chart can obviously visualize data. The data comes from various source types and currently, there are no helper methods of any kind to makes this possible. In v2.0 it will be possible to load data from CSV, JSON and predefined data arrays with a lot of customization options.
- Database support: In v2.0 we also bring read-only database support. The TTMSFNCChartDatabaseAdapter will be available as a separate component and will dynamically recognize fields as series with the flexibility of adding further customization.
- Grid linking: In the TMS FNC UI Pack, we have the TTMSFNCGrid component. In v2.0 it will be possible to link the grid to the chart via the TTMSFNCChartGridAdapter component.
An example based on cryptocurrency

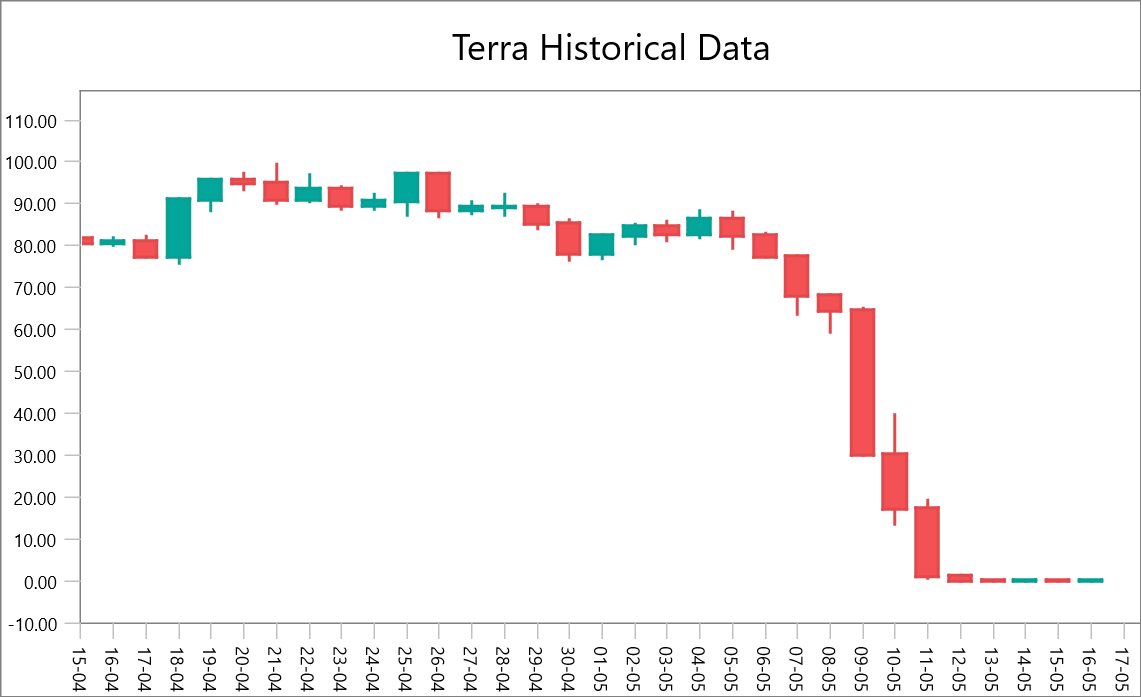
Cryptocurrency is hot topic and, in one way or another, keeps us occupied, interested at the very least. Looking up various known and lesser know cryptocurrencies typically represents the data in some form of financial chart. In FNC, we also support financial multipoint data series: OHLC, candlestick and boxplot. As an example, we took a month of data for the cryptocurrency known as "Terra-Luna". We extracted data and saved it to a CSV file. In v2.0 we will be able to load the data via the LoadFromCSVData method. Below is a sample on how this will be achieved.
TMSFNCCandleStickChart1.LoadFromCSVMultiPointData('LUNA.csv', 3, 4, 2, 1, -1, 0);
Executing this code, along side some additional load options, gives use the following chart.

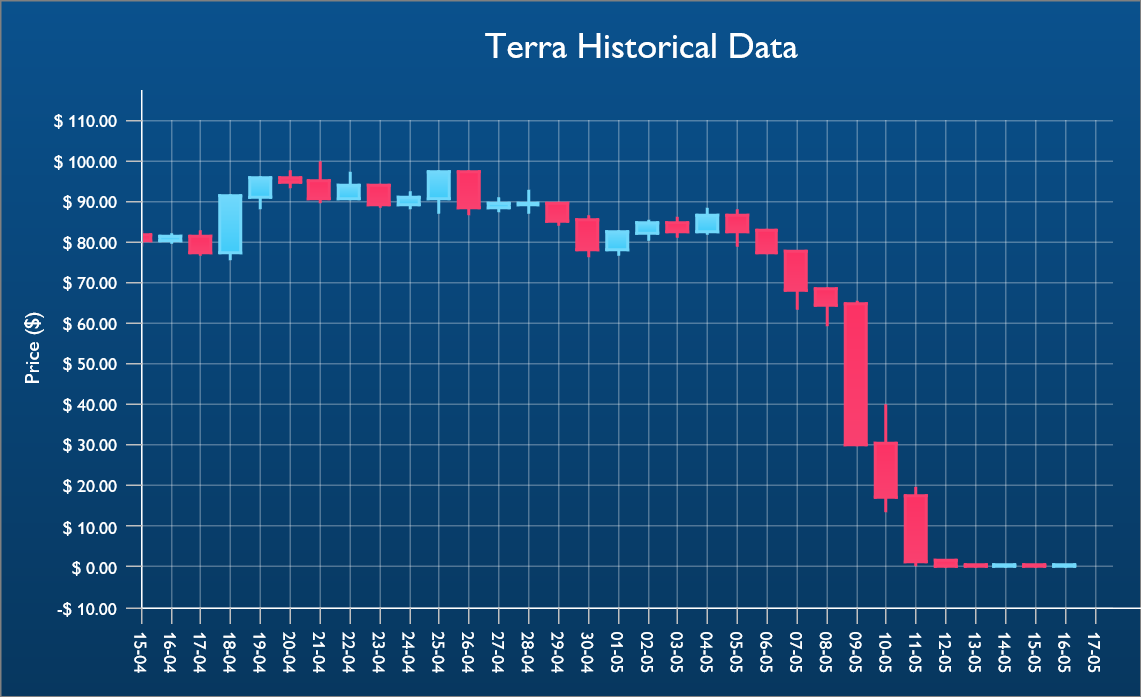
Now this looks quite promising already. Dropping a instance of TTMSFNCCandleStickChart on the form, specifying the data and displaying it in one go. If we would want to make a real application, we would need to apply some nicer look & feel. In TMS FNC Chart it's possible to customize and style each element. After applying the various appearance properties, we get the following result.

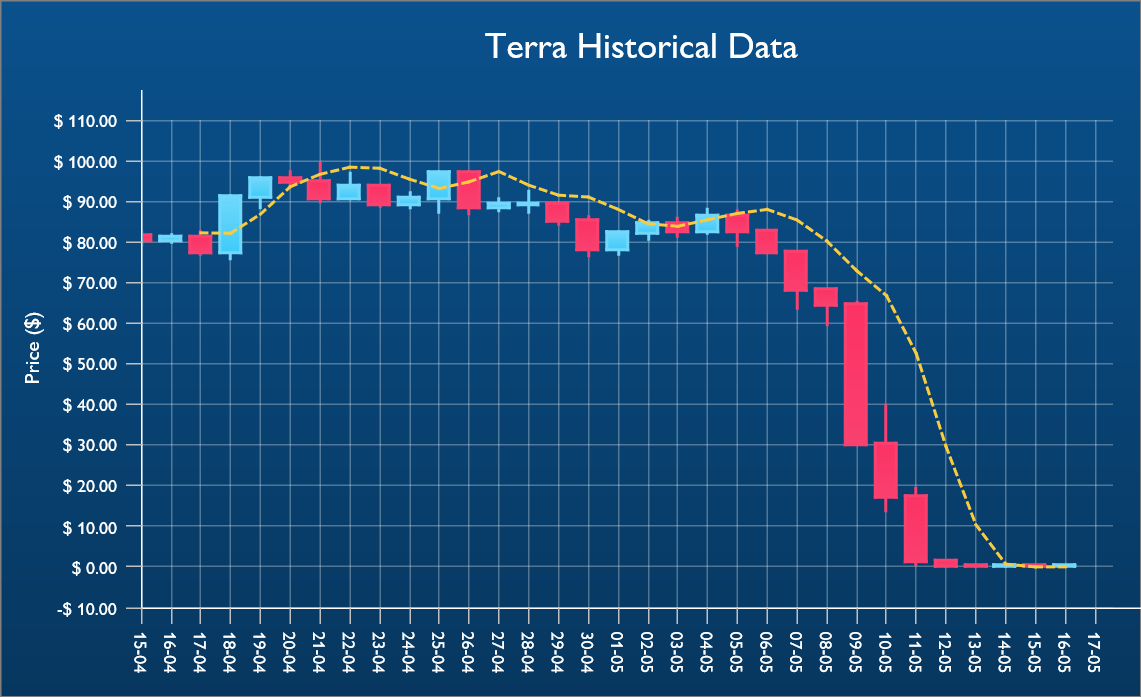
Financial experts will potentially be interested in some additional analytics for trend indication such as the moving average (MA). In TMS FNC Chart, we have a method that will automatically calculate this based on pre-existing data of another series. The code to execute this is
TMSFNCCandleStickChart1.AddMovingAverage(0, 0, TMSFNCCandleStickChart1.Series[0].Points.Count - 1, 2, False, $FFf9cb40, 2);

Coming soon
v2.0 is expected to be released in June and as an added bonus, the above sample will be included in the distribution. Stay tuned for more news coming soon!
Pieter Scheldeman

This blog post has received 3 comments.
 2. Sunday, August 6, 2023 at 5:53:58 AM
Looks great, but can I add multiple linked axis''s?
2. Sunday, August 6, 2023 at 5:53:58 AM
Looks great, but can I add multiple linked axis''s?For instance, if I want to add a volume series under the OHLC, or a function acting on the OHLC like MACD or RSI.
Pienaar JP

 3. Tuesday, August 8, 2023 at 8:33:06 AM
Hi, yes this should be possible.
Pieter Scheldeman
All Blog Posts | Next Post | Previous Post
Kevin Theobald