Blog
All Blog Posts | Next Post | Previous Post

 Data analytics & chart visualization in Delphi
Friday, April 1, 2022
Google Analytics helps to identify user browsing behavior. It is a powerful tool to analyze & monitor data and eventually adapt the content on your website to make sure users have a better experience. The purpose of this blog post is to capture realtime page visits on your website, analyze which browser is used and visualize it in a pie chart. The component capable of doing this is the TTMSFNCChart. At the end of this blog post, a sample is provided which allows you to see the code to retrieve the data from Google Analytics and how to configure the chart to display the results. Note that this sample also makes use of the component TTMSFNCCloudGoogleAnalytics which is part of the TMS FNC Cloud Pack.
Retrieving the data
After setting up Google Analytics, and setting up a connection via the TTMSFNCCloudGoogleAnalytics component, we call RetrieveData which asynchronously retrieves the data we are looking for. The code to properly setup the required data fields depends on a series of request parameters which are shown in the code snippet below.
procedure TGoogleAnalyticsForm.GetReportData;
begin
  ...

  TMSFNCCloudGoogleAnalytics1.RequestData.UserMetrics := UM;
  TMSFNCCloudGoogleAnalytics1.RequestData.PageMetrics:= PM;

  TMSFNCCloudGoogleAnalytics1.RequestData.PlatformOrDeviceDimension := DM;
  TMSFNCCloudGoogleAnalytics1.RequestData.SystemDimension := SM;
  TMSFNCCloudGoogleAnalytics1.RequestData.PageDimension := PGM;
  TMSFNCCloudGoogleAnalytics1.RequestData.TimeDimension := TM;

  TMSFNCCloudGoogleAnalytics1.RetrieveData(StartDate, EndDate, MaxResults);
end;

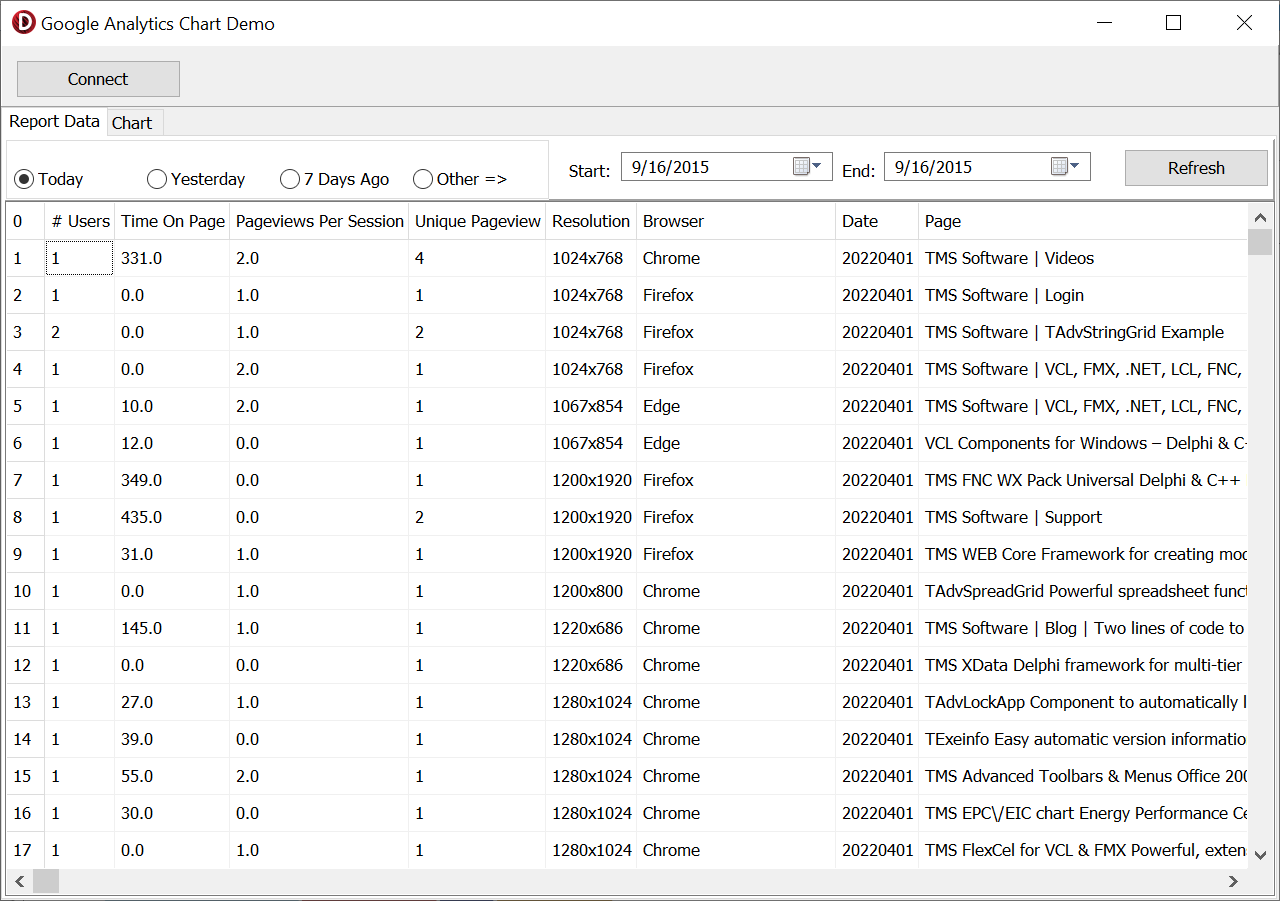
Note that we can see the amount of time the user spends on each page and which browser and resolution is used. This is realtime data!
Visualizing browser usage
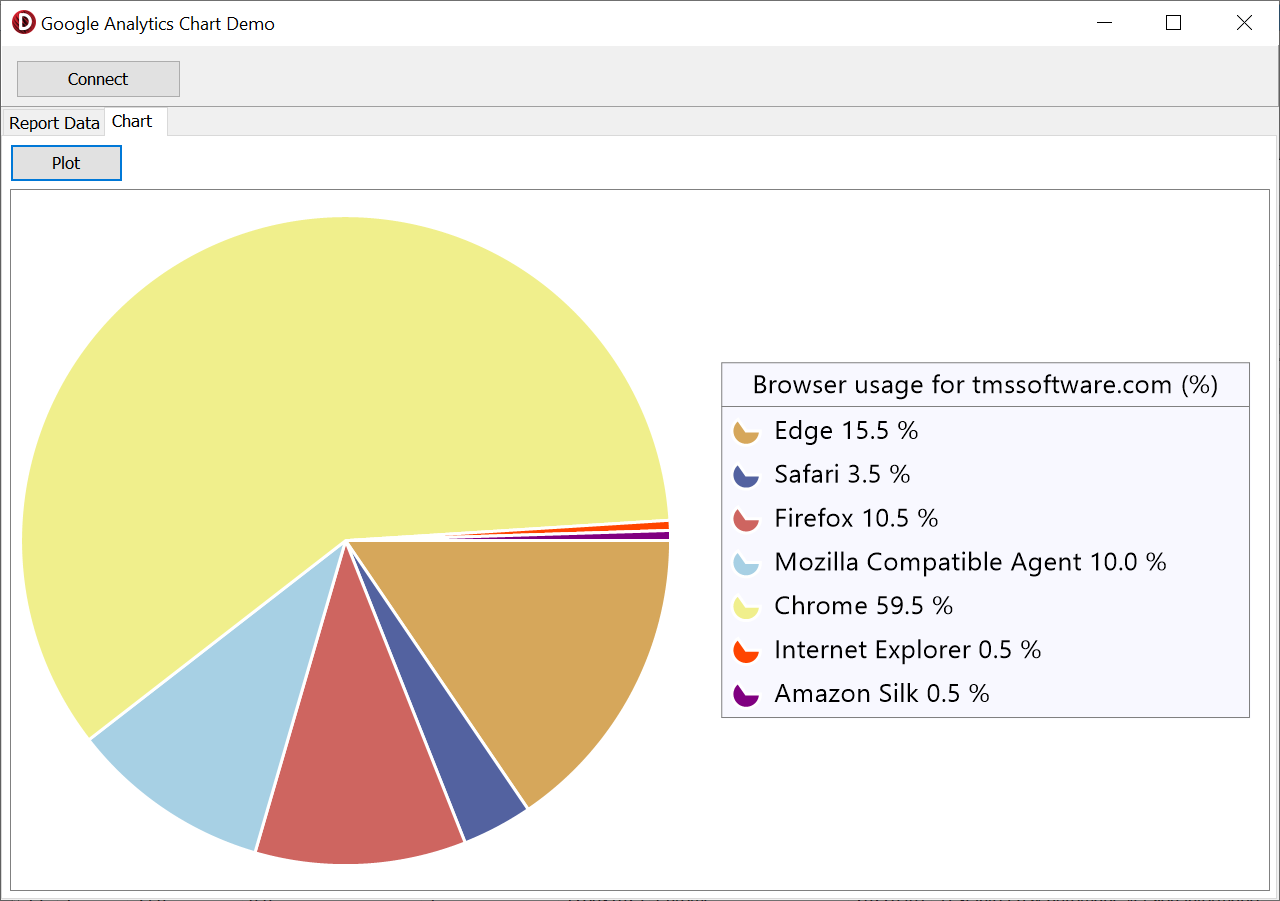
Whilst the grid shows the data after retrieval, it doesn't give an easy visual interpretation. You need to look carefully which browser is used, which page is visited, etc .. whilst scrolling through the grid. This is where TMS FNC Chart comes into play. Dropping an instance of TTMSFNCChart on the form immediately gives an idea of its capabilities. For this particular sample, we will configure a pie chart, which is ideal for displaying percentage numbers. We start by analyzing the browser column inside the grid, and count the duplicate entries.
d := TDictionary<string, Integer>.Create;
...
  for I := 1 to sgReport.RowCount - 1 do
  begin
    b := sgReport.Cells[6, I];
    if d.ContainsKey(b) then
      d[b] := d[b] + 1
    else
      d.Add(b, 1);
  end;
...var p: TTMSFNCChartSerie; ... TMSFNCChart1.BeginUpdate; TMSFNCChart1.Clear; p := TMSFNCChart1.Series.Add; p.ChartType := ctPie; TMSFNCChart1.EndUpdate; ...
Step 2 is to add points to the pie series. This is done by looping through the dictionary keys, which actually represent the browser, and retrieve the total value. Adding points in the chart is done with one of the multiple overloads, depending on the chosen type. For a pie chart, we use one of the AddPoint overloads, specifically to pass a value, color and a legend text.
for k in d.Keys do
begin
  if d.TryGetValue(k, v) then
  begin
    c := gcRed;
    if ci < Length(ca) then
      c := ca[ci];

    p.AddPoint(v, c, Format(k + ' %.1f %%', [v / t * 100]));
    Inc(ci);
  end;
end;
The default look and feel of the pie chart is sufficient for displaying the results, but we also want to visualize the actual values in a separate legend. In TMS FNC Chart each visual element is fully customizable, via properties and custom drawing events.
p.Pie.AutoSize := False;
p.Pie.Size := 650;
p.Pie.Position := ppCenterLeft;
p.Stroke.Color := gcWhite;
p.Stroke.Width := 3;
p.LegendText := 'Browser usage for tmssoftware.com (%)';
p.Legend.Visible := True;
p.Legend.Font.Size := 13;
p.ShowInLegend := False;

Interaction
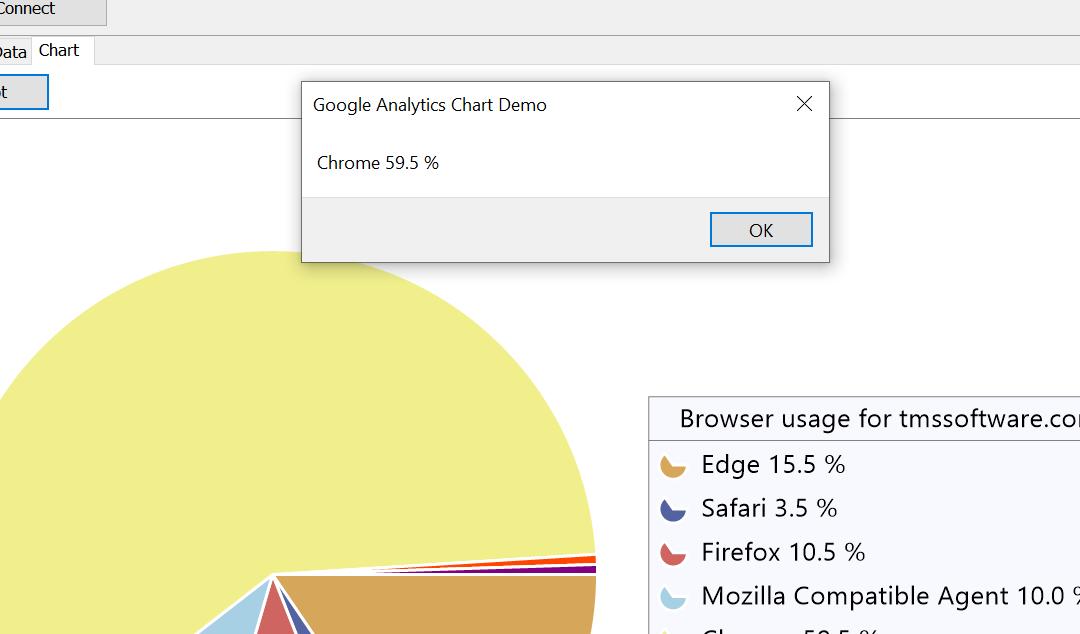
TMS FNC Chart allows a variety of interaction features, including detection when clicking on a slice of a pie chart. For the purpose of this sample, we want to click on a slice and display the value in a messagebox. To do this, we implement the OnSerieSliceClick event with the following code.
procedure TGoogleAnalyticsForm.TMSFNCChart1SerieSliceClick(Sender: TObject; APoint: TTMSFNCChartPoint);
begin
  ShowMessage(APoint.LegendText);
end;

Demo
As mentioned in the beginning of this blog post, we promised a sample. You can download the sample with full source code here: https://www.tmssoftware.com/download/samples/GoogleAnalyticsChartDemo.zip. The demo requires TMS FNC Cloud Pack & TMS FNC Chart
Pieter Scheldeman

This blog post has not received any comments yet.
All Blog Posts | Next Post | Previous Post