Blog
All Blog Posts | Next Post | Previous Post

 Introducing myCloudData.net from TMS: Pascal generated data consumed by Delphi
Monday, February 29, 2016
Recently, we opened the beta for our new myCloudData.net service. myCloudData.net is both a service and SDK to put structured data in the cloud. After a long time of experience with all kinds of cloud services (based on OAUTH/REST/JSON APIs), we were frustrated there was not really a fast, flexible, simple and easy to use service for storing data in a structured way in the cloud. And thus, many months ago, the idea was born to create a service ourselves. A service you can use directly from our servers as well as an SDK to make this service available on your own server(s) for public or internal-only use. To illustrate what myCloudData.net is about and what it can do for you, we decided to do a sample project, bringing several bits & pieces like Lego blocks together, including myCloudData.net, our cloud components, our Raspberry Pi hardware access library and our VCL chart component.The project
The project idea is really simple: a Raspberry Pi runs a Pascal application that retrieves the temperature from a temperature/barometric sensor and displays it on a 128x32 OLED screen and simultanously logs the retrieved temperature & pressure plus timestamp in the cloud in a simple table on the myCloudData.net service. At the other side, a Delphi VCL application retrieves the logged temperatures and displays the temperature in a chart. The idea is simple and the project is mainly about illustrating how fast such typical application can be put together with the right Lego blocks.

Used TMS components
For this project, we use quite a few TMS products. Of course, first there is the myCloudData.net cloud storage. We use the TMS Cloud Pack for VCL to access data from myCloudData.net and we use TMS Advanced Charts to display the data graphically and a TMS TAdvStringGrid to show the values in a grid. On the Raspberry Pi, we use the TMS LCL HW Pack to read our temperature & barometric sensor extension and to drive the 128x32 OLED display. Also used is the TMS LCL Cloud Pack to put the captured data on myCloudData.net
Setup
The first thing to do is creating an account on myCloudData.net. Head over to http://myCloudData.net and in a few seconds you can create a new account. Then, using this account, create a myCloudData.net application and you'll receive an application key and secret. This key & secret is used to connect from a Delphi app to myCloudData.net and in order to get started, the metadata is created for our table that will hold the captured sensor data. After dropping the TAdvmyCloudData component on the form, the code to do this is:
  // specify where to persist the TAdvMyCloudData access token once it is obtained
  AdvMyCloudData1.PersistTokens.Location := plIniFile;
  AdvMyCloudData1.PersistTokens.Key := '.myclouddata.ini';
  AdvMyCloudData1.PersistTokens.Section := 'tokens';

  // initializing the application key & secret for TAdvMyCloudData and setting the callback URL used in the authentication/authorization phase
  AdvMyCloudData1.App.Key := MYCLOUDDATAKEY;
  AdvMyCloudData1.App.Secret := MYCLOUDDATASECRET;

  AdvMyCloudData1.App.CallBackPort := 8888;
  AdvMyCloudData1.App.CallBackURL := 'http://127.0.0.1:8888';

  // obtain an access token or start using an existing access token to communicate with the service
  AdvMyCloudData1.Connect;
When either of these steps is succesfull, the TAdvmyCloudData.OnConnected event is triggered. In this event, we create the table on the myCloudData.net service when it does not already exist and the metadata is set. The code to do this is:
procedure TForm1.AdvMyCloudData1Connected(Sender: TObject);
var
  table: TmyCloudDataTable;
begin
  table := AdvMyCloudData1.TableByName('WEATHER');

  // when the table does not exist, create it and define its meta data
  if not Assigned(table) then
  begin
    table := AdvMyCloudData1.CreateTable('WEATHER');
    // string field that holds the ID of the Raspberry Pi generating the temperature/air pressure. Allows for multiple devices to log data
    table.MetaData.Add('STATIONID', ftString, 50);
    // timestamp of the measured temperature/air pressure
    table.MetaData.Add('TIMESTAMP',ftDateTime);
    // temperature & air pressure values
    table.MetaData.Add('TEMP', ftFloat);
    table.MetaData.Add('PRESS', ftFloat);
    table.SetMetaData;
  end;
end;
Generate the data from the Raspberry Pi with FPC/Lazarus/TMS LCL Cloud Pack and TMS LCL HW Pack
First of all connect the Adafruit 128x32OLED and Adafruit temperature/barometric sensor on the I2C pins of the Raspberry Pi.

Drop a TTMSLCLAdaDispl128x32 and TTMSLCLAdaBarTemp component on the form and open these devices with the code:
begin
  // initializes 128x32 OLED screen
  displ.InitGPIO;
  // open it, clear the display and show the text 'Ready....'
  if displ.Open then
  begin
    displ.Clear;
    displ.DrawTextLarge(0,4,'Ready....');
    displ.Display;
  end;
  // open the communication with the temperature/barometric sensor
  sensor.Open;
end;
Then also initialize the TTMSLCLCloudmyCloudData component. This initialization and connecting to the service is identical to its VCL counterpart:
procedure TForm1.FormCreate(Sender: TObject);
begin
  TMSLCLCloudMyCloudData1.PersistTokens.Location := plIniFile;
  TMSLCLCloudMyCloudData1.PersistTokens.Key := './myclouddata.ini';
  TMSLCLCloudMyCloudData1.PersistTokens.Section := 'tokens';

  TMSLCLCloudMyCloudData1.App.Key := MYCLOUDDATAKEY;
  TMSLCLCloudMyCloudData1.App.Secret := MYCLOUDDATASECRET;

  TMSLCLCloudMyCloudData1.App.CallBackPort := 8888;
  TMSLCLCloudMyCloudData1.App.CallBackURL := 'http://127.0.0.1:8888';

  TMSLCLCloudMyCloudData1.Connect;
end;
When the connection is succesful, the TTMSLCLCloudmyCloudData.OnConnected event is triggered where a reference (of type TmyCloudDataTable) to the WEATHER table on the service is obtained:
procedure TForm1.TMSLCLCloudMyCloudData1Connected(Sender: TObject);
begin
  table := TMSLCLCloudMyCloudData1.TableByName('WEATHER');
end;
The final step is to capture the sensor data and effectively store the measured values on the cloud service. This is done at regular intervals via a timer's OnTimer event:
procedure TForm1.Timer1Timer(Sender: TObject);
var
  t,p: single;
  s: string;
  dt: TDateTime;
  ent: TMyCloudDataEntity;
begin
  if sensor.Connected then
  begin
    // Alternatingly capture the temperature & air pressure from the sensor and display its value on the OLED screen
    if ShowTemp then
    begin
      t := sensor.GetTemperature;
      s := 'T:' + Format('%.2f',[t]) + ' C';
    end
    else
    begin
      p := sensor.GetPressure;
      s := 'P:' + Format('%.0f',[p]) + 'mBar';
      lastpress := p;
    end;

    displ.Clear;
    displ.DrawTextLarge(0,4,s);
    displ.Display;

    dt := Now;

    // when a pair of temperature & air pressure is captured, store it on the myCloudData.net service
    if ShowTemp then
    begin
      if Assigned(table) then
      begin
        ent := table.Entities.Add;
        ent.Value['STATIONID'] := 'Home';
        ent.Value['TIMESTAMP'] := dt;
        ent.Value['TEMP'] := t;
        ent.Value['PRESS'] := lastpress;
        ent.Insert;
      end;
    end;

    // toggle capture & display
    ShowTemp := not ShowTemp;
  end;
end;
The Windows Delphi VCL desktop app showing the graph of captured temperature values
With the Raspberry Pi code running to generate our sensor data on the myCloudData.net service, now we can write a simple VCL application (or FMX if you want to do the same on a mobile device or Mac OS-X) that shows a graph of the captured temperature.
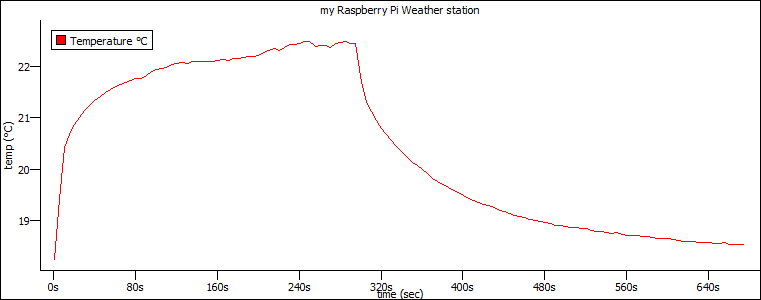
There is a one-time setup of the TMS Advanced Charts to have one line-chart and define the X-axis, Y-axis, Legend and Title text:
begin
  AdvChartView1.Panes[0].Series.Clear;
  AdvChartView1.Panes[0].Series.Add;
  AdvChartView1.Panes[0].Series[0].ChartType := ctLine;
  AdvChartView1.Panes[0].Series[0].LegendText := 'Temperature °C';
  AdvChartView1.Panes[0].Title.Text := 'my Raspberry Pi Weather station';
  AdvChartView1.Panes[0].XAxis.Text := 'time (sec)';
  AdvChartView1.Panes[0].YAxis.Text := 'temp (°C)';
end;
There is the same one-time setup of the TAdvmyCloudData component:
procedure TForm1.FormCreate(Sender: TObject);
begin
  AdvMyCloudData1.PersistTokens.Location := plIniFile;
  AdvMyCloudData1.PersistTokens.Key := '.myclouddata.ini';
  AdvMyCloudData1.PersistTokens.Section := 'tokens';

  AdvMyCloudData1.App.Key := MYCLOUDDATAKEY;
  AdvMyCloudData1.App.Secret := MYCLOUDDATASECRET;

  AdvMyCloudData1.App.CallBackPort := 8888;
  AdvMyCloudData1.App.CallBackURL := 'http://127.0.0.1:8888';

  AdvMyCloudData1.Connect;
end;
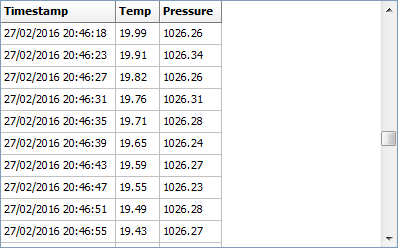
Upon succesful connection, it's straightforward to retrieve all captured values and display this in a TMS TAdvStringGrid and TMS Advanded Chart with the code:
procedure TForm1.GetRecords;
var
  i,r: integer;
  dt: TDateTime;
  t,p: double;
begin
  // retrieve entities via the TAdvmyCloudData table
  table.Query();

  // setup the needed nr. of rows in the grid
  AdvstringGrid1.RowCount := 1 + table.Entities.Count;

  // set the X-axis range of the chart
  AdvChartView1.Panes[0].Range.RangeFrom := 0;
  AdvChartView1.Panes[0].Range.RangeTo := table.Entities.Count;

  // fill both chart & grid
  AdvChartView1.BeginUpdate;

  for i := 0 to table.Entities.Count - 1 do
  begin
    r := i + 1;

    dt := table.Entities[i].Value['TIMESTAMP'];
    t := table.Entities[i].Value['TEMP'];
    p := table.Entities[i].Value['PRESS'];

    AdvStringGrid1.Cells[0,r] := formatDateTime('dd/mm/yyyy hh:nn:ss', dt);
    AdvStringGrid1.Floats[1,r] := t;
    AdvStringGrid1.Floats[2,r] := p;

    AdvChartView1.Panes[0].Series[0].AddSinglePoint(t,inttostr(i*5)+'s');
  end;

  AdvChartView1.EndUpdate;

  AdvStringgrid1.AutoSizeColumns(false);
end;
To have some meaningful data for this sample project, we measured the sensor temperature reaction speed. This is done by a forced temperature increase with a heating source and then remove the heating source. In this chart, we can see the temperature every 4 seconds. It's very nice to see a fast and asymptotic curve of the reaction to a heat source and a much slower but also asymptotic curve of the reaction to cooling off.
Summary
We wanted to show how easy and fast it has become to have in this case two different Pascal applications working on the same cloud data. In less than one hour, you can setup a structured data storage in the cloud, write a Pascal Raspberry Pi app that talks to sensors, OLED displays and cloud data and at the same time a Delphi Windows, Mac OS-X or mobile device app that visualizes the Raspberry Pi captured data. All this requires literally not much more than hooking up some TMS components like we built the fire and police station with Lego blocks a couple of decennia ago, proving once more we, Pascal developers, are blessed with having a fun job.
Bruno Fierens

This blog post has not received any comments yet.
All Blog Posts | Next Post | Previous Post