Blog
All Blog Posts | Next Post | Previous Post

 From Lego to TComponent...
Monday, March 23, 2015
In my childhood, I was always fascinated by Lego. I spent countless hours building all kinds of things with Lego, many times a town, all kinds of houses but never forgetting a few sporty cars to accompany each house. What I could build with Lego was mostly limited by my imagination and the number of blocks I had (which was eventually quite a lot as I didn't let any anniversary or special celebration go by to ask for more Lego blocks as a gift). What is so nice about Lego is the easy to use interface between all kinds of blocks. All blocks fit on other blocks and can be effortlessly put together.

From my Lego time, fast-forward about 20 years, in 1995 Delphi brought us the concept of TComponent, an evolution of the TObject originated in Turbo Pascal. TComponent was an invention as magic as the Lego building block. While seamlessly interfacing with its parent, siblings, childs, the major difference with the basic Lego block is that a component can be heavily characterized through its properties. This makes 'playing' with components even more fun, interesting & challenging than playing with Lego was. At TMS software, it is always my objective to build interesting components that are as intuitive as possible to use and that could do interesting things while requiring to write a minimum amount of plumbing code to use them. With a wave of new components we released in the past quarter, I set a challenge for myself to explore and smoothen the ways to interface these building blocks to each other. In this article I wanted to highlight the easiness of bringing together quite sophisticated stand-alone components or building blocks to create powerful solutions.
To demonstrate this, we start with the versatile TMS TAdvStringGrid. With a few properties, this turns into an editable 2D data structure. In our sample, the grid is used to present or capture sales information for a 12 month period. The majority of the effort to write code for this sample goes into initializing the grid. In this case, all we still need to do in code is initialize the data contained in the grid:
var
  i: integer;
begin
  AdvStringGrid1.EditLink := AdvRichEditorEditLink1;
  AdvStringGrid1.Cells[1,1] := '';
  AdvStringGrid1.Cells[2,1] := 'Sales of development tools products per month';
  AdvStringGrid1.MergeCells(2,1,2,1);
  AdvStringGrid1.Cells[0,1] := 'Name';
  AdvStringGrid1.Cells[0,0] := 'Month';
  AdvStringGrid1.Cells[1,0] := 'Units';
  AdvStringGrid1.Cells[2,0] := 'Sales';
  AdvStringGrid1.Cells[3,0] := '% Market';

  for i := 2 to 13 do
  begin
    AdvStringGrid1.Cells[0,i] := FormatSettings.ShortMonthNames[i - 1];
    AdvStringGrid1.Ints[1,i] := Random(100);
    AdvStringGrid1.Ints[2,i] := Random(10000);
    AdvStringGrid1.Ints[3,i] := Random(50);
  end;
end;
  AdvChartLink1.Active := true;
  AdvChartLink2.Active := true;
  AdvChartLink3.Active := true;

All we do is initialize the content of the document a little bit with:
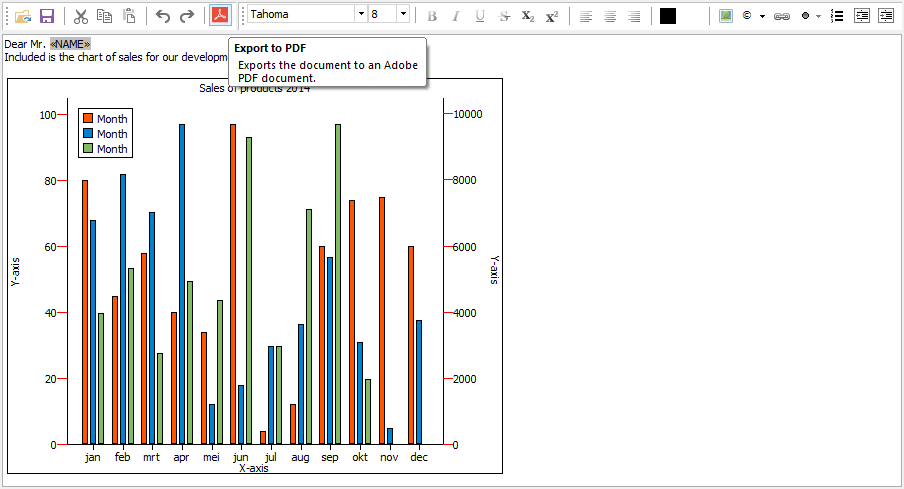
  AdvRichEditor1.InsertMultiLineText('Dear Mr. NAME'#13);
  AdvRichEditor1.SelStart := 9;
  AdvRichEditor1.SelLength := 4;
  AdvRichEditor1.SetSelectionMergeField('NAME');

  AdvRichEditor1.InsertMultiLineText('Included is the chart of sales for our development tool product.'#13#13);
  AdvRichEditor1.AddGraphic(500,400,'CHART');
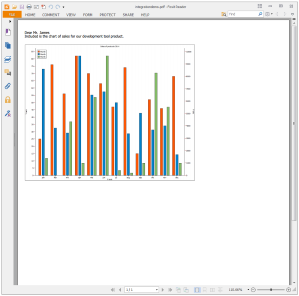
The chart is added with initial dimensions 500 x 400px and with ID CHART. To have the chart displayed in the document, the event handler to draw custom graphic objects in the document needs to be coded:
procedure TForm1.AdvRichEditor1DrawGraphic(Sender: TObject; ACanvas: TCanvas;
  ARect: TRect; AID: string);
begin
  if AID = 'CHART' then
    AdvChartView1.PrintAllPanes(ACanvas, ARect);
end;procedure TForm1.AdvStringGrid1CellValidate(Sender: TObject; ACol,
ARow: Integer; var Value: string; var Valid: Boolean);
var
sl: TStringList;
begin
if (ACol = 1) and (ARow = 1) then
begin
AdvRichEditor1.UnMerge;
sl := TStringList.Create;
try
sl.Values['NAME'] := Value;
AdvRichEditor1.Merge(sl);
finally
sl.Free;
end;
end;
end;begin AdvRichEditorPDFIO1.Save; end;

While not really functionally used in the sample, we just wanted to show yet another seamless integration between the TAdvRichEditor and TAdvStringGrid. In this case, the integration means we can use the TAdvRichEditor as inplace editor in the grid. And here comes yet another integration as this inplace TAdvRichEditor can optionally have a popup formatting toolbar for on-the-fly formatting of the editor content without the need for extra screen estate to put another toolbar or ribbon.

Get started by playing with these building blocks with the sample you can download here and the latest versions of TMS Component Pack and TMS Advanced Charts. We hope this article is an inspiration to have you create other powerful integrations. We're curious to see your results and hear about any suggestions you might have for new integrations or things that can make the integrations even smoother.
Bruno Fierens

This blog post has received 1 comment.
All Blog Posts | Next Post | Previous Post
Mehrdad Esmaeili