Blog
All Blog Posts | Next Post | Previous Post

 Finding memory leaks in Delphi for iOS
Monday, June 2, 2014
Introduction
Delphi has a very high degree of compatibility between desktop and mobile code: with some little differences, code written for Win32 will run fine in iOS and Android.Many of those differences are in strings, like not having UTF8 strings (which I hope they'll finally see the light and re-add some day), or having zero-based strings instead of 1-based (which if you are writing code for both mobile and desktop, and you are not into self infringed pain, you'll just want to make all strings 1-based by writing {$ZEROBASEDSTRINGS OFF} everywhere in your units).
But on this post I wanted to focus in what is probably the biggest difference between Delphi mobile and Delphi desktop: Automatic Reference Counting (ARC). As you will probably know, ARC is a "light" kind of garbage collection which works by keeping the number of objects which have a reference to another object. When the reference count drops to 0 (nobody is using the object), it is automatically destroyed. Most of the time ARC works fine and allows you to replace of thousands of lines like:
  Whatever := TWhatever.Create;
  try
     DoSomething(Whatever);
  finally
     Whatever.Free;
   end;
by simply
DoSomething(TWhatever.Create);
Delphi will take care of destroying whatever for you when it is not used anymore, and generally this is a good thing (™), since in most cases the more work the compiler does for you the better. The compiler will never forget to free an object. But ARC comes with some disadvantages too: Not only it will be slower since it has to increase and decrease the reference counting of the objects in a thread safe way (most likely involving locks), but even worse, code that runs without leaks in "Classic Delphi" might start to leak when compiled with ARC.. This is a very serious problem, because it won't manifest itself immediately. The converted desktop code will work fine in mobile, but under the hood memory usage will grow continually until the app crashes because it runs out of memory. So we need a way to catch and fix those memory leaks.
ARC and Circular References
The problem with ARC is simple: Classes that directly or indirectly reference themselves (think in double linked lists, or any cache scheme where the main objects keep a reference to the cache, and the cache to the main object). In those cases you have a situation like the following: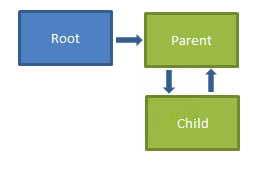
"Parent" has 2 references (one from the root object which created it, the other from the child). Child has 1 reference from the parent. When we exit the method, "Parent" reference count will drop to 1 and child reference count will stay at 1 too. Neither parent or child will be destroyed, and they will leave forever happily ever after: each one of them keeping the other alive.
And note that even if you explicitly call Parent.Free, it still won't be destroyed. In ARC, Free just sets the object to nil, breaking the reference from Root to Parent and decreasing the reference count to 1, but the reference from the child will still be there, keeping the Parent alive. You would have to call Parent.DisposeOf to explicitly call the parent destructor, and in the parent destructor set Child to nil. Code that used to run fine in Desktop (where you call Parent.Free) stops working when you use it in ARC. And this is a problem. For this particular case, ARC not only didn't remove any existing leak, but it introduced one.
So how do we fix it?Delphi has a [WEAK] attribute that you can use to "break" those reference loops. By marking the child reference as weak, it won't count towards the parent's reference count.
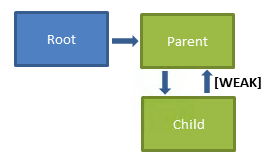
With the [weak] reference now parent reference count will be 1 and not 2, and when the reference from root is broken, parent and child will be destroyed. And this should be enough theory for now: time to get our hands dirty with some real code.
Creating the memory leak
Let's start with two simple classes that reference themselves:type TChild = class; TParent = class public FChild: TChild; constructor Create; destructor Destroy; override; end; TChild = class public FParent: TParent; constructor Create(const aParent: TParent); destructor Destroy; override; end;
{ TParent }

constructor TParent.Create;
begin
  FChild := TChild.Create(self);
end;

destructor TParent.Destroy;
begin
  ShowMessage('Parent destroyed!');
  inherited;
end;

{ TChild }

constructor TChild.Create(const aParent: TParent);
begin
  FParent := aParent;
end;

destructor TChild.Destroy;
begin
  ShowMessage('Child destroyed!');
  inherited;
end;
procedure TForm1.Button1Click(Sender: TObject);
var
  Parent: TParent;
begin
  Parent := TParent.Create;
end;
If we aren't fully convinced yet, one way to verify it is to place a breakpoint under the Parent := TParent.Create line, and look at the reference count of the object:

As you can see, refcount is 2: One for the "Parent" variable and the other from the child. When we exit the method, refcount will go down to 1, but it will never be 0 and the object will never be destroyed.
So now the question is: How can we find leaks in a big project? We can't go logging all destructors and we can't check all the refcounts of all the objects. When writing Win32/Win64 code, we have an invaluable tool: FASTMM. Either by writing ReportMemoryLeaksOnShutdown := True; in your app startup code, or by using the full FASTMM debug options, you can easily find the objects that have leaked in your app.
But there is no FASTMM for iOS; iOS memory allocations requests go directly to the iOS memory allocator. One idea could be to target "Win32" for our mobile application and try to use our Win32 leak detection techniques there:
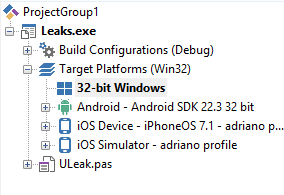
But alas, the "Win32" target doesn't have ARC, so no objects will be destroyed at all. We'll have to try a different approach: We'll try the native OSX tools instead. XCode comes with a very helpful tool not so helpfully named "Instruments", which can be used to profile and look at leaks in objective-C apps. Given that Delphi in OSX uses the same LLVM backend and Debug information as XCode, it would be expected that we can use the same tools as in XCode. And it turns out we can.
Finding the leak
First steps first, we'll start by launching Instruments. You can do it by launching XCode, then go to Menu->XCode->Open Developer Tool->Instruments: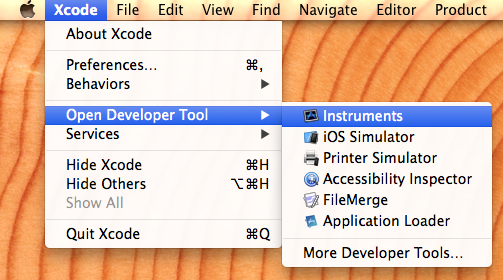
Of course, once it opens you might want to keep it in the dock to be able to open it faster next time. While in this post we will be only showing how to find memory leaks, Instruments is a very powerful tool which includes a CPU profiler, memory diagnostics, I/O activity and much more. If you are doing serious iOS work, you are likely to spend a lot of time in Instruments.
You should be greeted by a screen similar to this one:
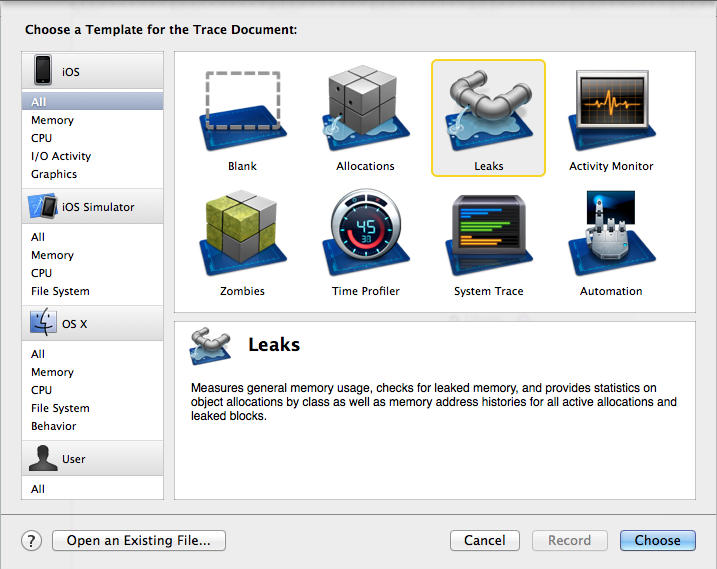
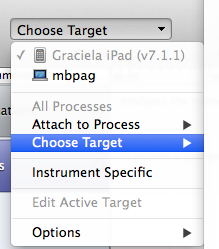
From here, we will select "iOS" at the left (Leak detection won't work in the iOS simulator), and then "Leaks" at the right. Once in the main Instruments screen, we need to choose the app to profile. We'll select the iOS device (again, leak detection won't work in the simulator) and then select our app from the "Choose target" menu inside the "Choose target" combobox:
In the short video below, I'll show how profiling the app looks like. I've marked some interesting parts on it:
1) Choose a target. This is where we select the app that we have previously deployed to the device. Make sure to deploy it in DEBUG mode so symbols are loaded.
2) Record. When we press "Record" the app starts in the device, and the profiler starts running. At first the "Allocations" profiler is selected, and while it has a lot of interesting information on its own, for this article we are interested in the leaks. So we select "Leaks" from the left sidebar.
3) Snapshot. On the lower left pane, we have the "Snapshots" section. By default it takes a memory snapshot every 10 seconds, but we can select the interval or manually trigger one. In this video we pressed the button on the device, then pressed the "Snapshot Now" button in Instruments, and a memory leak is shown. After that we pressed the button twice more, and then "Snapshot Now" again. You can see the leak count increases to 3. You can also see the red bars in timeline showing when the leaks where created.
4) Inspect the call stack. By pressing the button to show the right pane in Instruments, we can take a look at the stack trace that lead to the leak. You can see that even when this is a delphi app, the debug information is all there, and you can see the actual delphi class names like "TParent", and the method names like "Button1Click". This makes it really easy to pinpoint the troubling parts.
5)Inspect the cycles. Finally, we can also look at a view that is helpful to see the cycles. In this case the cycles are very simple so the diagram doesn't add much, but in a more complex case this can also help finding the element that is leaking.
Fixing the code
Now that we have find the offending code, the last step is to fix it. To do that, just add a [WEAK] attribute to the child reference to the parent.The child class will end up as follows:
TChild = class
  public
  [Weak]FParent: TParent;
  constructor Create(const aParent: TParent);
  destructor Destroy; override;
end;
If we run the application now, we should finally be able to see the messages in the destructor:

And Instruments should show no cycles or leaks. Also if you debug the application and inspect the reference count for parent, it should never be 2.
Ok, I think this should be it. Have a happy leak hunting, and don't forget to explore the other "Instruments" available in "Instruments" like the allocation or cpu profilers. Most instruments work just fine with Delphi apps, and there are a couple of jewels waiting for you on there.
Adrian Gallero

This blog post has received 2 comments.
 2. Wednesday, November 15, 2017 at 8:04:43 AM
is there a way to do the same thing for android?
anthony
All Blog Posts | Next Post | Previous Post
Perhaps helpful for more Informations :-)
https://www.youtube.com/watch?v=9s3iOML_0T4&list=UU8cmxRNEOaSxhFjf3oRzT1A
Daniel Magin