Frequently Asked Component Specific Questions
Options |
|
Display all FAQ items |
Displaying items 1 to 1 of 1, page 1 of 1
<< previous next >>

 TMS VCL Chart
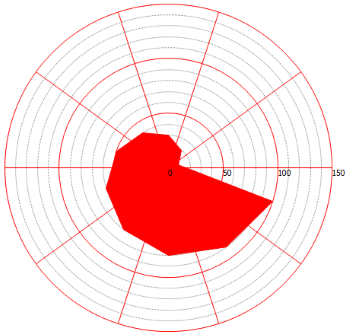
How to configure the y-axis and y-grid of a spider chart
Simply drop a chart on the form and set the code in the formcreate. The y-axis and y-grid are configured to display every 20 units.
Sample code:
var
  s: TChartSerie;
  p: TChartPane;
  I: Integer;
begin
  AdvGDIPChartView1.BeginUpdate;
  AdvGDIPChartView1.Panes.Clear;
  p := AdvGDIPChartView1.Panes.Add;
  p.YAxis.AutoUnits := False;
  p.YGrid.AutoUnits := False;
  s := p.Series.Add;
  s.ChartType := ctSpider;
  s.Pie.Size := 300;
  s.YAxis.AutoUnits := False;

  s.YAxis.MajorUnit := 50;
  s.YAxis.MinorUnit := 10;

  p.YGrid.MinorDistance := 10;
  p.YGrid.MajorDistance := 50;

  p.YGrid.MajorLineColor := clRed;

  for I := 0 to 9 do
  begin
    s.AddSinglePoint((I + 1) * 10);
  end;

  AdvGDIPChartView1.EndUpdate;