Frequently Asked Component Specific Questions
Options |
|
Display all FAQ items |
Displaying items 1 to 1 of 1, page 1 of 1
<< previous next >>

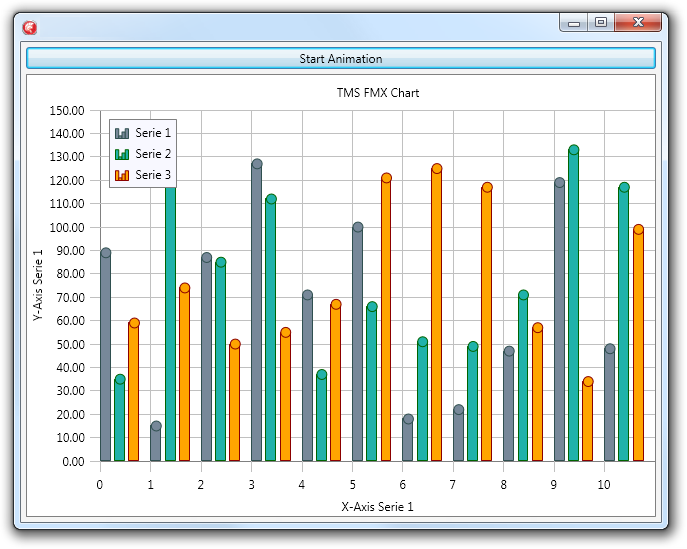
 TMS FMX Chart
How to add animation when series are added
The TMS Chart for FireMonkey includes a simple animation mode to animate the series from 0 values to the values that are added or vice versa. The AnimationFactor and AnimationFlow properties on Series level determine the speed and mode. There are 2 events that can be used to trace progress: OnAnimateSerieStarted and OnAnimateSerieFinished.
Here you can download a demo that adds animation and triggers it from a button click. Clicking a second time reverts the bars back to zero.