TAdvStringGrid
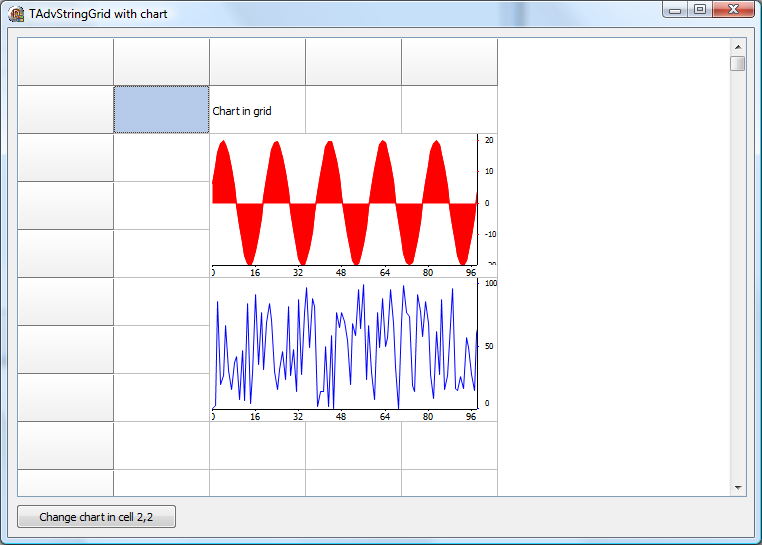
Example 74 : Embedding charts in TAdvStringGrid
 In sample 72, it was shown how interfaces allowed to use any kind of graphic control inside TAdvStringGrid. The main enabler for this is the ICellGraphic interface:
ICellGraphic = Interface
  procedure Draw(Canvas: TCanvas;R: TRect; Col,Row: integer; Selected: boolean; Grid: TAdvStringGrid);
  function CellWidth: integer;
  function CellHeight: integer;
  function IsBackground: boolean;
end;
In this sample, it will be shown how a class TAdvChart, internally used and available in TMS TAdvChartView can be used to draw charts within a cell or cells of TAdvStringGrid. A TAdvChart is the class within a chartview pane that is responsible for the drawing of the chart. This class is used here in a TInterfacedPersistent descending class that implements the ICellGraphic interface:
TChartCell = class(TInterfacedPersistent, ICellGraphic)
private
  FChart: TAdvGDIPChart;
  procedure SetChart(const Value: TAdvGDIPChart);
public
{ Interface }
  procedure Draw(Canvas: TCanvas;R: TRect; Col,Row: integer; Selected: boolean; Grid: TAdvStringGrid);
  function CellWidth: integer;
  function CellHeight: integer;
  function IsBackground: boolean;

  constructor Create;
  destructor Destroy; override;
  property Chart: TAdvGDIPChart read FChart write SetChart;
end;
All this class does is create an instance of TAdvGDIChart (can be TAdvChart for a non GDI+ version). In the Draw method implementation it uses this chart to perform the drawing. The CellWidth / CellHeight function implementations return 0 as the chart will size automatically with the cell dimensions instead of having a fixed size. The IsBackground function returns false as we do not assume it is desirable to put text on top of the chart.
The implementation as such looks like:
{ TChartCell }

function TChartCell.CellHeight: integer;
begin
  Result := 0;
end;

function TChartCell.CellWidth: integer;
begin
  Result := 0;
end;

constructor TChartCell.Create;
begin
  inherited Create;
  FChart := TAdvGDIPChart.Create(self);
end;

destructor TChartCell.Destroy;
begin
  FChart.Free;
  inherited;
end;

procedure TChartCell.Draw(Canvas: TCanvas; R: TRect; Col, Row: integer;
Selected: boolean; Grid: TAdvStringGrid);
var
  dr: trect;
begin
  dr := r;
  dr.Left := dr.Left + 2;
  FChart.Draw(Canvas,dr,1,1,true);
end;
When this class is available, it is easy to start using it to insert a chart in a grid cell or cells. To do this, create an instance of TChartCell and add it to the grid via the grid.AddInterfacedCell method. Make sure to destroy this instance for example from the FormClose event.
procedure TForm1.FormCreate(Sender: TObject);
var
 cc: TChartCell;
begin
  cc := TChartCell.Create;
  AdvStringGrid1.AddInterfacedCell(2,2,cc);
end;

procedure TForm1.FormClose(Sender: TObject; var Action: TCloseAction);
begin
AdvStringGrid1.GetInterfacedCell(2,2).Free;
end;
When the ChartCell is available, the chart properties can be set via ChartCell.Chart and the chart data can be added via ChartCell.Chart.Series as in the sample code below:
with cc.Chart.Series.Add do
begin
  // choose chart type
  ChartType := ctArea;

  // fill with sinusoidal data
  for i := 1 to 100 do
    AddSinglePoint(20 * sin(i /PI));

  // select range of data to display
  cc.Chart.Range.RangeFrom := 0;
  cc.Chart.Range.RangeTo := 99;

  // hide default legend
  cc.Chart.Legend.Visible := false;

  // set chart x-axis size & fontsize
  cc.Chart.XAxis.Size := 12;
  cc.Chart.XAxis.Font.Size := 7;

  // set serie x-axis
  XAxis.MajorFont.Size := 7;
  XAxis.MajorUnitSpacing := 0;
  XAxis.MajorUnit := 1;

  // set x-axis tickmark
  Xaxis.TickMarkSize := 2;
  XAxis.TickMarkWidth := 1;
  XAxis.TickMarkColor := clBlack;

  // set chart y-axis size & position
  cc.Chart.YAxis.Position := yRight;
  cc.Chart.YAxis.Size := 20;

  // enable auto units on y-axis
  cc.Chart.YAxis.AutoUnits := true;

  // set serie y-axis
  YAxis.Position := yRight;
  YAxis.MajorUnitSpacing := 8;
  YAxis.MajorFont.Size := 6;
  YAxis.MajorUnit := 1;

  // set y-axis tickmark
  YAxis.TickMarkColor := clRed;
  YAxis.TickMarkSize := 2;
  YAxis.TickMarkWidth := 1;

  // enable auto ranging
  AutoRange := arEnabled;
end;
The chart can be updated at any time this way. After updating the chart programmatically, force a repaint of the chart by calling grid.RepaintCell(col,row);
Delphi project & source files for downloading included in the main demos distribution for Delphi
×
![]()